A neighbor of mine spent nearly eight months planning her rooftop solar installation. She’d done everything right — read the government incentive pages, got three contractor quotes, even joined an online forum. Then, on her very first net metering bill, the credit was less than half of what she’d calculated. Turned out one key piece of the puzzle — panel orientation versus her utility’s time-of-use rate schedule — had never been explained to anyone at any point in the process. Sound familiar? Let’s walk through what actually matters when you’re figuring out solar power for your home in 2025, with the real numbers and the real gotchas.
Why Solar Still Makes Sense in 2025 — But Not for the Reasons You Think
The sales pitch hasn’t changed much: ‘Go solar, cut your bill, save the planet.’ And honestly, those things are still true. But the math behind them has shifted considerably over the past couple of years, and if you’re using 2022 or 2023 figures, you might be in for a surprise.
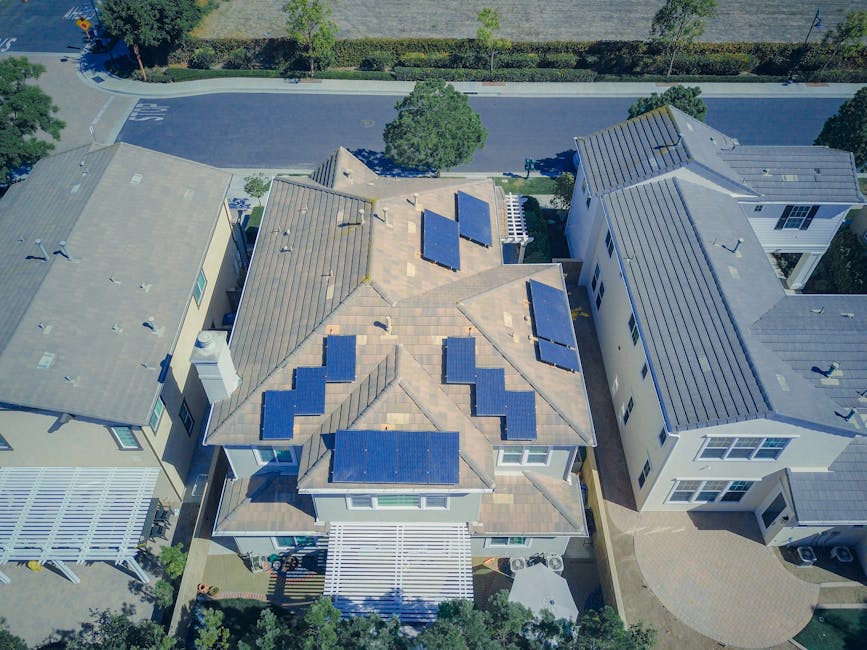
As of early 2025, the average residential solar panel cost in the US sits around $2.80–$3.20 per watt installed, before incentives. A typical 8 kW system — enough to offset most of a 2,000 sq ft home’s usage — therefore runs $22,400–$25,600 upfront. The federal Investment Tax Credit (ITC) still stands at 30% under the Inflation Reduction Act, which slices that to roughly $15,700–$17,900 after credit. Many states add on top of that: Massachusetts offers an additional 15% state credit (capped at $1,000), while New York’s NY-Sun incentive can knock off another $1.00/watt.
Payback periods in high-electricity-cost states like California (averaging $0.29/kWh in 2025), Massachusetts ($0.28/kWh), and Hawaii ($0.39/kWh) now sit between 6–9 years for most homeowners. In low-cost states like Louisiana ($0.11/kWh) or Arkansas ($0.10/kWh), that stretches to 14–18 years — and that’s where solar math genuinely starts to wobble.
The Spec Sheet Nobody Gives You
Before you sign anything, here are the actual technical specs you need to compare — and what they mean in plain English:
- Panel Efficiency (%): Most mainstream panels in 2025 land between 20–23%. Premium options like the Maxeon 7 hit 24.1%. Higher efficiency matters if your roof space is limited.
- Temperature Coefficient (% per °C): This tells you how much power the panel loses as it heats up. Look for values around -0.26%/°C or lower (Panasonic EverVolt, REC Alpha). Cheaper panels often run -0.35%/°C, which hurts output in hot summers.
- Degradation Rate: Industry standard is about 0.5%/year output loss. A good panel at year 25 should still produce ~88% of original capacity. Confirm this in the product warranty, not the sales brochure.
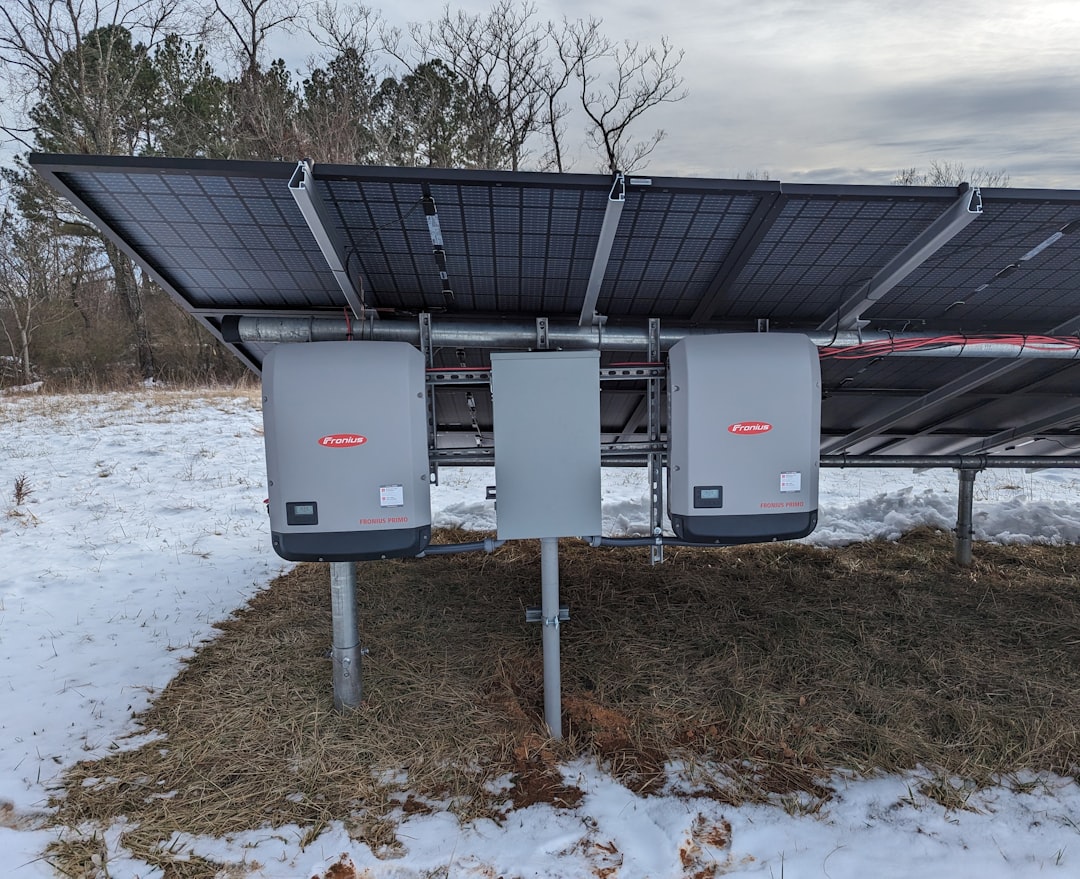
- Inverter Type: String inverters ($1,000–$2,000) are cost-effective but suffer if any one panel is shaded. Microinverters (Enphase IQ8 series, ~$180–$220 per unit) optimize each panel independently — critical for complex rooflines or partial shading.
- Battery Storage (Optional but trending): The Tesla Powerwall 3 (13.5 kWh, ~$11,500 installed) and Enphase IQ Battery 5P (5 kWh, ~$4,500 installed) are the two most-installed options in 2025. Without storage, you export excess energy — at rates your utility decides, not you.
- Net Metering Policy: This is the hidden variable. California’s NEM 3.0 (active since April 2023) slashed export rates by ~75% compared to NEM 2.0. If your utility has similarly restructured net metering, your ROI calculations need a complete redo.
The Error Nobody Warns You About: Rate Schedule Mismatch
This is exactly what tripped up my neighbor. Most utilities in 2025 have shifted to Time-of-Use (TOU) rate schedules, which means electricity costs more during peak hours (typically 4–9 PM on weekdays) and less during off-peak times (overnight, midday). Here’s the problem: your panels are generating maximum power from about 10 AM to 2 PM — precisely when electricity is cheapest under TOU rates. You export cheap energy and then buy back expensive peak energy in the evening.
Concrete example: Under PG&E’s E-TOU-C rate in California, off-peak energy costs $0.27/kWh while peak costs $0.46/kWh. If you export 20 kWh during midday (credited at ~$0.08/kWh under NEM 3.0) and import 12 kWh during peak hours, your net bill increases versus what simple headline numbers suggest. The fix? Battery storage shifts your self-generated power into the evening, letting you avoid buying at peak rates. The math for adding a Powerwall 3 often closes within 3–4 additional years of payback in high-TOU-differential markets.
What Real Installers Are Seeing in 2025
Speaking with installers across several markets — SunPower’s retail network, Sunrun franchisees, and independent NABCEP-certified contractors — a few patterns emerge consistently this year:
First, supply chain pressures have eased significantly compared to 2022–2023. Panel lead times are down to 2–6 weeks for most Tier 1 brands (LONGi, Jinko, Canadian Solar), and microinverter availability has normalized after the 2023 Enphase inventory correction. This means you have real negotiating leverage again — don’t accept the first quote.
Second, workmanship warranty gaps remain a serious issue. Most manufacturer warranties cover panels for 25 years, but installer labor warranties vary wildly: 1 year from some, 10 years from reputable firms. A roof penetration that leaks five years from now isn’t covered by the panel warranty. Always ask specifically what the labor/workmanship coverage is, in writing.
Third, the permitting timeline in many municipalities has actually gotten longer in 2025 due to increased solar adoption volume overwhelming local building departments. In some California counties, permit approval alone takes 6–10 weeks. Factor this into your planning window.
Alternatives Worth Considering Before You Commit
Solar isn’t the only answer, and depending on your specific situation, it might not even be the best one. Here’s a realistic framework:
- If your roof is older than 12–15 years: Get a roofing assessment first. Removing and reinstalling panels for a roof replacement mid-lease or mid-loan costs $2,500–$5,000 extra. Sometimes re-roofing before solar installation (potentially bundled with solar financing) is the smarter sequence.
- If you’re in a low-electricity-cost state: Community solar subscriptions (available in ~24 states as of 2025) let you subscribe to a share of a larger solar farm and receive bill credits — no rooftop hardware, no maintenance headaches, and often 5–15% savings with zero capital outlay.
- If you rent or have a shaded roof: Green power purchasing programs through your utility, or RECs (Renewable Energy Certificates), let you support solar economically without physical installation.
- If you want the full setup but hate financing risk: Power Purchase Agreements (PPAs) from companies like Sunrun or SunPower allow zero upfront cost — you just buy the power the panels generate at a locked rate. The tradeoff: you don’t own the system, so the ITC goes to the installer, not you, and home sale complications can arise.
A Quick Sanity-Check Checklist Before Signing
- ✅ Confirm your utility’s current net metering / export compensation rate (not from the solar company — directly from the utility’s website)
- ✅ Pull your last 12 months of electricity bills and calculate actual kWh consumed, not just dollar amounts
- ✅ Ask for a shading analysis report (reputable installers use Aurora Solar or Helioscope to model this)
- ✅ Verify the installer’s NABCEP certification and check their BBB and Google reviews for post-installation service stories
- ✅ Get clarity on interconnection timeline — utility approval to actually turn on your system can add 4–12 weeks after physical installation
- ✅ Understand exactly what happens to your system contract if you sell your home in the next 5 years
The honest picture of residential solar in 2025 is genuinely positive for the right homes in the right markets — but ‘right’ is doing a lot of work in that sentence. The incentive structure is still compelling, technology keeps improving, and installation costs have stabilized. The pitfalls, though, are real and specific: TOU rate mismatches, net metering policy changes, workmanship warranty gaps, and the perennial challenge of matching system size to actual consumption rather than optimistic projections.
From one energy-curious homeowner to another: before you sign anything, spend two hours pulling your utility’s actual current net metering tariff document and running the TOU numbers against your own usage profile. It’s not the glamorous part of going solar — but it’s the part that determines whether your payback period is 7 years or 14. And that difference is very much worth the homework.
📚 관련된 다른 글도 읽어 보세요
- Why I Almost Missed My Flight Trusting Google Maps — Real 2025 Incheon Airport Guide
- Why My First Solo Trip to Cape Verde Almost Ended in Disaster — Honest 2025 Travel Guide
- Why I Almost Missed My Flight Trusting Online Guides — Real 2025 Incheon Airport Terminal 1 vs 2 Guide
태그: home solar power, residential solar installation, solar panel cost 2025, net metering, home battery storage, solar ROI, renewable energy home
Leave a Reply