Category: Uncategorized

  • 미국주식 이거 모르면 2026년도 또 손실? 배당성장주 vs 성장주 완전 정복 가이드

    얼마 전에 친한 형한테 연락이 왔어요. “야, 나 S&P500 ETF 꾸준히 넣었는데 왜 내 계좌는 맨날 제자리야?” 솔직히 그 말 듣고 피식 웃음이 나왔습니다. 형이 틀린 게 아니에요. 전략 없이 ‘아무거나 미국주식이면 오르겠지’ 마인드로 접근하면, 2026년에도 똑같이 멍하니 계좌를 바라보게 됩니다. 배당성장주와 성장주, 이 두 가지를 제대로 이해하지 못하면 아무리 적립식으로 넣어봤자 내 포트폴리오는 언제나 절반짜리입니다. 오늘 이걸 완전히 정리해드릴게요.

    • 📌 배당성장주 vs 성장주, 도대체 뭐가 다른가?
    • 📌 2026년 기준 실제 수익률 비교 (수치로 확인)
    • 📌 대표 종목 심층 분석 — SCHD, MSFT, NVDA, AAPL
    • 📌 비교표: 어떤 투자자에게 무엇이 맞는가
    • 📌 해외 투자 전문가들이 말하는 2026년 전략
    • 📌 절대 하지 말아야 할 실수 7가지
    • 📌 FAQ — 독자 질문 모음
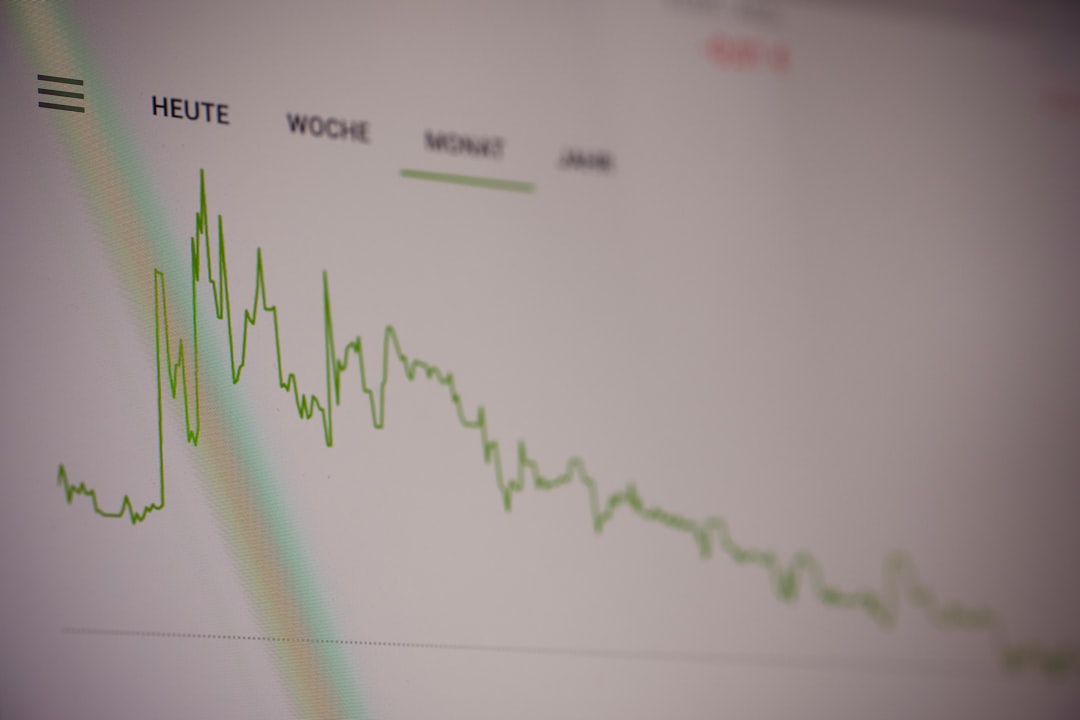
    US stock market chart growth dividend comparison 2026

    📊 배당성장주 vs 성장주, 기본부터 제대로 짚고 가자

    배당성장주(Dividend Growth Stock)란 매년 꾸준히 배당금을 증가시켜온 기업의 주식을 말합니다. 대표적으로 존슨앤드존슨(JNJ), 프록터앤드갬블(PG), 코카콜라(KO) 같은 종목들이죠. 이런 기업들은 배당을 10년, 20년, 심지어 50년 이상 연속으로 올려왔어요.

    성장주(Growth Stock)는 현재 이익보다 미래 성장 가능성에 주가가 프리미엄을 받는 기업입니다. 엔비디아(NVDA), 테슬라(TSLA), 팔란티어(PLTR) 같은 종목이 여기 해당돼요. 배당은 거의 없거나 아주 소액이고, 대신 주가 상승으로 수익을 추구합니다.

    문제는 많은 개인 투자자들이 이 두 가지를 “그냥 미국 주식”으로 뭉뚱그려서 본다는 거예요. 마치 치킨이랑 삼겹살을 둘 다 ‘고기’라고 부르는 거랑 같습니다. 물론 둘 다 고기지만, 먹는 방식도 효능도 완전히 다르죠.

    📈 2026년 기준 실제 수익률 데이터로 보는 현실

    감이 아니라 숫자로 봐야 제대로 판단할 수 있습니다.

    배당성장주 대표 ETF — SCHD (Schwab U.S. Dividend Equity ETF)

    • 최근 5년 연평균 총수익률(CAGR): 약 11.2% (배당 재투자 포함)
    • 현재 배당수익률: 약 3.5~3.8%
    • 배당 연평균 성장률(DGR, 10년): 약 12%
    • 하락장(2022년 기준) 낙폭: 약 -19% (S&P500 대비 선방)

    성장주 대표 — NVDA

    • 최근 5년 주가 상승률: 약 +1,800% (2021~2026 누적)
    • 배당수익률: 약 0.03% (사실상 없음)
    • 최대 드로다운(MDD): 약 -66% (2022년 하락 기준)
    • PER(주가수익비율): 약 35~45배 (고평가 논란 상시)

    여기서 핵심이 나옵니다. NVDA가 5년에 1,800% 오르는 동안, 만약 2022년 고점에 물렸다면 원금 회복에만 2년 이상이 걸렸어요. 반면 SCHD는 같은 기간 하락장에서 -19% 수준에 그쳤고, 배당을 꾸준히 수령하면서 심리적으로도 버틸 수 있었죠.

    손실 시나리오 명시: 만약 2026년에 연준(Fed)이 예상보다 금리를 더 올리거나, AI 거품 논란이 현실화될 경우, NVDA 같은 고PER 성장주는 -40% ~ -60% 조정이 충분히 가능합니다. 역사적으로 금리 급등 시기에 성장주는 PER 압축을 맞으며 반토막 나는 경우가 비일비재했어요. 반면 배당성장주는 같은 환경에서 -15% ~ -25% 수준으로 방어하는 경향이 있습니다.
    SCHD dividend growth ETF portfolio chart performance

    🔍 대표 종목 4개 심층 분석

    ① SCHD — 배당성장 ETF의 교과서
    운용사 찰스 슈왑이 만든 이 ETF는 배당 일관성, 현금흐름, 재무건전성을 기준으로 종목을 필터링합니다. 단순 고배당이 아니라 ‘오래 줄 수 있는 배당’을 선별한다는 점이 핵심이에요. 2026년 현재 보유 종목 상위에는 브로드컴(AVGO), 텍사스 인스트루먼트(TXN), 버라이즌(VZ) 등이 포함돼 있습니다.

    ② MSFT (마이크로소프트) — 성장+배당의 하이브리드
    배당수익률은 약 0.7%로 낮지만, 배당 성장률은 연 10% 이상을 유지하고 있어요. 클라우드(Azure)와 AI(Copilot) 성장 동력이 살아있고, 재무구조가 탄탄합니다. 순수 성장주보다 변동성이 낮고, 순수 배당주보다 성장성이 높아요. 둘 사이의 균형을 원한다면 1순위 후보.

    ③ NVDA (엔비디아) — 수익률 왕이지만 멘탈 필요
    AI 칩 시장 점유율 80% 이상. H100, B200 수요는 2026년에도 여전히 강하지만, AMD와 인텔의 추격, 중국 수출 규제 변수는 리스크입니다. 이 종목은 전체 포트폴리오의 10% 이하로 가져가는 걸 권장해요. 올인은 진짜 안 됩니다.

    ④ AAPL (애플) — 애매한 위치, 그래도 핵심
    아이폰 매출 성장 둔화, 서비스 매출 확대. 배당수익률은 약 0.5%로 낮지만 자사주 매입 규모가 연간 900억 달러 수준으로 주주환원이 막강합니다. 성장주로 보기엔 성숙했고, 배당주로 보기엔 수익률이 낮아요. ‘우량주 코어 보유’로 접근하는 게 맞습니다.

    📋 비교표: 어떤 투자자에게 무엇이 맞는가

    구분 배당성장주 (SCHD 등) 성장주 (NVDA, TSLA 등) 하이브리드 (MSFT, AAPL)
    목표 수익 안정적 현금흐름 + 자산 증식 단기~중기 자본이득 극대화 중장기 균형 성장
    배당수익률 3.5~4.5% 0~0.1% 0.5~0.8%
    변동성 (베타) 낮음 (0.7~0.9) 높음 (1.5~2.5) 중간 (1.0~1.2)
    하락장 방어력 ✅ 강함 ❌ 취약 ⚠️ 보통
    추천 투자 기간 10년 이상 (은퇴 대비) 3~7년 (리스크 감수 가능) 5~15년
    적합한 투자자 40대 이상, 안정 추구형 20~30대, 리스크 허용형 30~40대, 균형형
    2026년 리스크 금리 상승 시 주가 소폭 하락 AI 버블 붕괴 시 -40~60% 성장 둔화 우려
    세금 효율 배당세 15.4% (국내 기준) 양도세 위주 혼합

    🌐 해외 투자 전문가들이 말하는 2026년 전략

    모닝스타(Morningstar) 수석 애널리스트 데이브 세컨다(Dave Sekera)는 2026년 전망에서 “밸류에이션 부담이 높아진 상황에서 고배당·배당성장 전략이 하방 리스크를 제어하는 유효한 수단”이라고 언급했습니다.

    뱅가드(Vanguard) 리서치팀은 2026년 향후 10년 미국 주식 연평균 수익률을 4.2%~6.2%로 예측하며, 과거 10년(2016~2025) 대비 낮아질 가능성이 있다고 경고했어요. 이 말인즉, 성장주 일변도 전략의 기대 수익이 줄어들 수 있다는 의미입니다.

    반면 아크인베스트(ARK Invest)의 캐시 우드는 여전히 AI·바이오 성장주 중심의 강세론을 유지하고 있습니다. 하지만 ARK ETF의 2022년 -75% 낙폭을 기억한다면, 이 의견을 맹신하는 건 위험합니다. “비전은 옳을 수 있지만 타이밍은 틀릴 수 있다”는 교훈이에요.

    국내에서는 미래에셋증권의 글로벌투자전략팀이 “2026년 달러 약세 가능성을 감안할 때, 배당성장 ETF와 일부 성장주를 6:4로 섞는 바벨 전략이 유효하다”는 리포트를 발표한 바 있습니다.

    🚫 절대 하지 말아야 할 실수 7가지

    • ① 배당수익률만 보고 매수 — 배당률 10%짜리 종목은 왜 그렇게 높은지 먼저 의심해야 합니다. 주가 폭락 + 배당컷 조합이 기다리고 있을 수 있어요.
    • ② 성장주에 전 재산 몰빵 — NVDA가 1,800% 올랐다는 사실 뒤에, 2022년 -66% 구간에서 반 이상이 손절했다는 사실도 기억하세요.
    • ③ 환율 무시 — 원/달러 환율이 1,400원대에서 1,200원대로 내려가면, 달러 수익이 원화로 변환 시 20% 이상 깎일 수 있습니다. 환헤지 여부를 확인하세요.
    • ④ 배당 재투자 안 하기 — 복리 효과는 재투자에서 나옵니다. SCHD를 20년 보유할 때 배당 재투자 유무의 차이는 최종 자산 기준 2~3배까지 벌어질 수 있어요.
    • ⑤ 테마주 쫓아가기 — ‘AI주 다 올랐다더라’는 뉴스가 나올 때는 이미 고점일 가능성이 높습니다. 뉴스 사이클을 쫓으면 항상 마지막 물림이 됩니다.
    • ⑥ 분기 배당금을 생활비로 쓰기 — 자산 형성기에는 배당금을 무조건 재투자해야 합니다. 배당 받으면서 기분 좋아하지 마세요. 그게 복리 엔진 꺼버리는 행동입니다.
    • ⑦ 포트폴리오 리밸런싱 미루기 — 성장주가 급등하면 자연스럽게 그 비중이 커집니다. 연 1~2회 목표 비중으로 되돌리는 리밸런싱을 하지 않으면 어느새 초고위험 포트폴리오가 되어 있어요.

    ❓ FAQ

    Q1. SCHD가 국내에서도 살 수 있나요? ETF 세금은 어떻게 되나요?

    네, 국내 증권사 해외주식 계좌를 통해 바로 매수할 수 있어요. 배당소득세는 미국에서 원천징수 15%, 국내에서 추가로 0.4% 적용됩니다 (실질 약 15.4%). 연간 배당 수령액이 2,000만 원을 초과하면 금융소득종합과세 대상이 될 수 있으니 이 부분은 미리 체크하세요. ISA 계좌 활용 시 비과세 혜택이 있으므로 적극 검토해 볼 것을 권장합니다.

    Q2. 20대 초반인데 지금 당장 성장주보다 배당성장주를 넣는 게 맞을까요?

    솔직히 말하면, 20대 초반이라면 리스크 감수 능력이 가장 높은 시기입니다. 하지만 ‘올인’은 어떤 방향으로도 추천하지 않아요. 제가 권장하는 비율은 성장주 50~60% + 배당성장주(SCHD 등) 30~40% + 현금성 자산 10% 정도입니다. 성장주로 공격하되, 하락장에서 배당주가 심리적 쿠션이 되어줍니다. 아무것도 안 하는 것보다 이 조합이 훨씬 낫습니다.

    Q3. PLTR(팔란티어)는 2026년에도 들고 가야 할까요?

    팔란티어(PLTR)는 정부·방산 데이터 분석 분야에서 독점적 위치를 가지고 있고, 민간 기업 AI 플랫폼(AIP) 성장도 인상적입니다. 다만 2025년 말 기준 PER이 100배를 넘어서는 고평가 구간이에요. 이 종목은 ‘테마’에 베팅하는 성격이 강합니다. 포트폴리오의 5% 이하로 가져가면서 모니터링하는 전략이 현실적이에요. 혹시 전체 포트폴리오의 20~30% 이상을 PLTR에 넣고 계신다면, 진지하게 리밸런싱을 고려해야 합니다.


    한 줄 평: “배당성장주는 지루하지만 잠을 자면서도 돈이 쌓이는 시스템이고, 성장주는 짜릿하지만 멘탈 관리비가 따로 든다. 2026년 기준으로는 두 가지를 적절히 섞되, 단일 종목 몰빵만 피해도 절반은 성공이다.”

    이 글을 읽고 있는 지금이 포트폴리오를 점검할 최적의 타이밍입니다. 주식 시장은 기다려주지 않아요. 오늘 계좌 한 번 열어서 내 비중을 확인하는 것부터 시작해보세요. 그게 첫 번째 진짜 투자입니다.


    📚 관련된 다른 글도 읽어 보세요

    태그: 미국주식, 배당성장주, 성장주, SCHD, 미국주식투자전략, 2026주식, 배당ETF
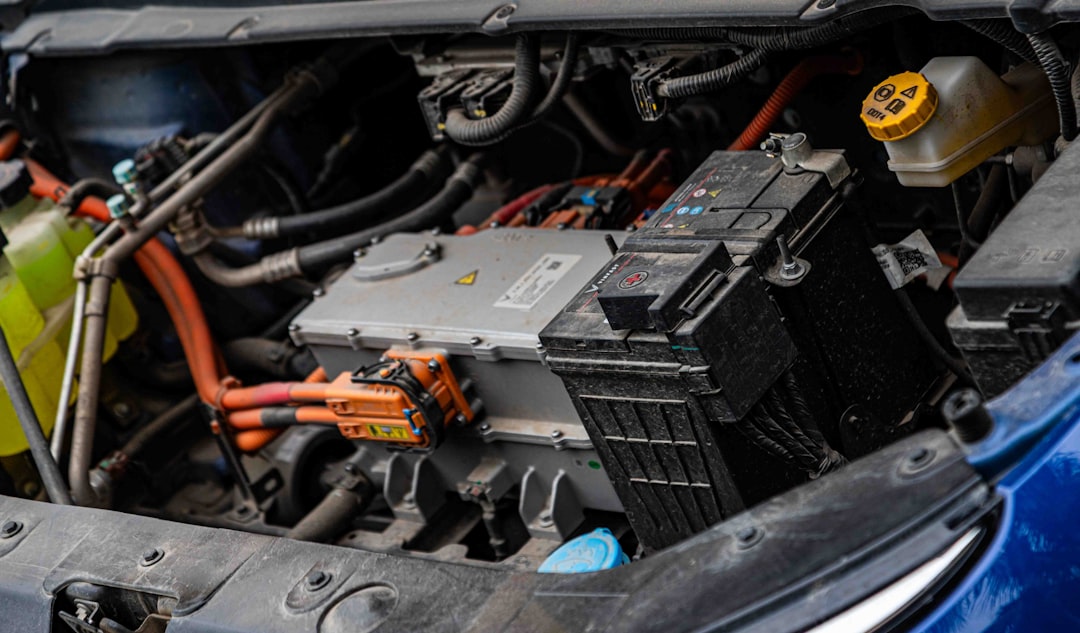
  • 전기차 배터리 교체 비용, 직접 당해보고 나서야 알았다 — 2026년 기준 현실 가이드

    작년에 지인이 전화 한 통을 해왔어. “야, 나 전기차 배터리 교체 견적 받았는데 1,800만 원 나왔어. 이거 실화야?” 처음엔 나도 귀를 의심했다. 근데 실화다. 그것도 5년 된 국산 전기차 기준으로. 그 순간부터 나도 본격적으로 파고들기 시작했고, 지금 이 글은 그 삽질의 결과물이야.

    전기차 배터리 교체 비용은 단순히 ‘부품값 + 공임’이 아니야. 보증 조건, 배터리 잔존가치(SOH), 제조사 정책, 심지어 차를 언제 샀냐까지 전부 변수로 작동해. 이거 모르고 그냥 딜러한테 맡겼다가는 진짜로 천만 원 단위로 날릴 수 있어.

    electric vehicle battery replacement cost, EV battery pack disassembly
    • 📊 2026년 기준 전기차 배터리 교체 비용 실측 데이터
    • 🔋 제조사별 배터리 보증 조건 비교표 (현대/기아/테슬라/GM)
    • ⚠️ 교체 전 반드시 확인해야 할 SOH(잔존 용량) 기준
    • 💸 보조금·보증 활용하면 실제 부담액이 얼마나 줄어드나
    • 🚫 절대 하지 말아야 할 실수 TOP 5
    • ❓ 독자들이 가장 많이 묻는 FAQ 3가지

    📊 2026년 기준 전기차 배터리 교체 비용 실측 데이터

    일단 숫자부터 보자. 말로만 “비싸다”고 하면 체감이 안 되니까.

    2026년 현재 국내 주요 전기차 모델의 배터리 교체 비용(공식 서비스 센터 기준, 부가세 포함)은 대략 다음과 같아:

    • 현대 아이오닉5 (77.4kWh 롱레인지): 약 1,400만~1,700만 원
    • 기아 EV6 (77.4kWh): 약 1,350만~1,650만 원
    • 테슬라 모델3 롱레인지 (75kWh): 약 1,600만~2,000만 원 (수입 부품 환율 반영)
    • 쉐보레 볼트EV (65kWh): 약 900만~1,200만 원 (GM 공급가 인하 이후)
    • 르노 조에 (52kWh): 약 750만~950만 원

    여기서 핵심 변수가 하나 더 있어. 배터리를 통째로 교체하냐, 모듈 단위로 교체하냐에 따라 비용이 30~50% 차이가 나. 예를 들어 아이오닉5의 경우 배터리 팩 전체 교체 시 1,600만 원대지만, 불량 모듈 1~2개만 교체하면 400만~600만 원 선에서 끝나는 경우도 있어. 근데 문제는 모듈 단위 교체가 가능한지 여부가 제조사 정책마다 달라.

    EV battery module replacement, lithium battery pack cost breakdown

    🔋 제조사별 배터리 보증 조건 비교 (2026년 기준)

    배터리 교체 비용에서 제일 먼저 확인해야 할 게 바로 보증 조건이야. 보증 기간 내에 있으면 ‘공짜’에 가깝게 처리되거든. 근데 이 보증이 생각보다 복잡해.

    제조사 / 모델 보증 기간 보증 주행거리 SOH 보증 기준 모듈 교체 가능 여부
    현대 아이오닉5/6 10년 20만 km 70% 이하 시 교체 가능 (조건부)
    기아 EV6/EV9 10년 20만 km 70% 이하 시 교체 가능 (조건부)
    테슬라 모델3/Y 8년 롱레인지 24만 km 70% 이하 시 교체 불가 (팩 통째 교체)
    쉐보레 볼트EV 8년 16만 km 60% 이하 시 교체 가능
    르노 코리아 조에 8년 16만 km 66% 이하 시 교체 불가
    BMW iX3 8년 16만 km 70% 이하 시 교체 불가

    여기서 뼈아픈 포인트 하나. “10년 보증”이라고 해서 무조건 교체해준다는 게 아니야. SOH가 70% 이상이면 제조사 입장에서 “정상 범위”라고 판단하고 교체 거부할 수 있어. 즉, 10년 됐어도 SOH 72%면 넌 본인 돈 내야 해.

    🔬 SOH(배터리 잔존 용량)란 무엇이고, 내 차는 몇 %일까

    SOH(State of Health)는 배터리가 새 제품 대비 얼마나 용량을 유지하고 있냐는 수치야. 100%가 신품, 70% 이하면 제조사 보증 교체 대상이 돼.

    문제는 이걸 일반인이 눈으로 확인하기 어렵다는 거야. 테슬라는 앱에서 일부 확인이 가능하지만 정확하진 않고, 현대·기아는 공식 진단 장비(GDS)가 있어야 정확한 SOH 측정이 가능해. 비공식으로 OBD2 어댑터 + LeafSpy, CanSee, EVNotify 같은 앱을 쓰는 방법도 있는데, 이건 어디까지나 참고용이지 공식 보증 청구 근거로는 인정 안 돼.

    실제로 내 주변에서 OBD2로 SOH 67% 나왔다고 보증 교체 신청했다가, 공식 진단에선 71% 나와서 거절당한 케이스가 있었어. 측정 툴이 다르면 결과가 다르게 나올 수 있으니까, 공식 센터 방문 전에 비공식 수치만 믿고 큰소리 치지 마.

    💸 보조금·보증 잘 활용하면 실제 부담액이 얼마나 줄어드나

    2026년 기준으로 배터리 교체 관련 지원 제도는 크게 세 가지야.

    1. 제조사 보증 (무상 교체): 앞서 말한 보증 기간·주행거리·SOH 조건 충족 시 비용 없음. 이게 제일 베스트 시나리오야.

    2. 환경부 전기차 배터리 지원 제도: 2025년부터 확대된 ‘전기차 배터리 성능 보장제’ 하에서, 저소득층·영업용 전기차 운전자를 대상으로 교체 비용의 최대 50%, 한도 600만 원까지 지원하는 제도가 운영 중이야 (지자체별 상이, 반드시 사전 신청 필요).

    3. 중고 재생 배터리 활용: 공식 채널은 아니지만, 폐차된 전기차에서 분리한 리퍼비시 배터리를 활용하는 업체들이 늘고 있어. 비용은 신품 대비 30~40% 저렴하지만, AS와 성능 보장이 불투명하다는 단점이 있어. 공식 센터에서는 당연히 안 해줌.

    정리하면: 보증 내 교체 → 지원금 활용 → 리퍼비시 배터리 순서로 검토하는 게 합리적이야.

    📉 배터리 교체 vs 차량 처분, 어느 게 더 이득일까

    이건 진짜 중요한 계산이야. 배터리 교체 비용이 1,500만 원이라면, 차를 팔고 새 전기차를 사는 게 더 나을 수도 있거든.

    시나리오 예상 비용 장점 단점
    배터리 교체 (기존 차 유지) 1,200만~1,800만 원 취등록세 없음, 익숙한 차량 고출력 충전 성능 한계, 구형 OTA
    차량 처분 후 신차 구매 추가 2,000만~4,000만 원 (중고가 상계 후) 최신 배터리·기술·보조금 취등록세, 초기 감가 리스크
    리퍼비시 배터리 교체 600만~900만 원 비용 절감 AS 불확실, 공식 보증 없음
    중고 전기차로 교체 추가 500만~1,500만 원 비교적 저비용 배터리 이력 불투명

    내 의견으로는, 차량 구매 후 6년 이상 경과 + SOH 65% 이하 + 배터리 보증 만료 상황이라면 신차나 최신 중고차로 갈아타는 게 장기적으로 더 유리한 경우가 많아. 단, 현재 차에 대출이 남아있거나, 희귀 모델이거나, 주행거리가 극히 적다면 교체가 합리적일 수 있어.

    📰 국내외 사례 — 실제로 이런 일이 있었다

    2025년 말, 국내 한 소비자 커뮤니티(클리앙, 보배드림)에서 5년 된 코나 EV 배터리 교체 견적이 1,200만 원 나왔다는 글이 화제가 됐어. 댓글에는 “차값이 1,200만 원도 안 되는데?”라는 반응도 있었고, 실제로 그 차주는 결국 중고차로 처분했어.

    해외 사례도 있어. 미국 테슬라 포럼(Tesla Motors Club)에서 모델S(초기형 85kWh) 배터리 교체를 테슬라 공식으로 받으면 $13,000~$16,000(약 1,800만~2,200만 원)이라는 글이 다수 올라와 있어. 반면 써드파티 업체 EV Battery Solutions를 활용하면 $7,000~$9,000대로 내려간다는 후기도 있지만 보증 공백이 생기지.

    국내에서는 2024년 환경부가 전기차 배터리 이력 관리 시스템을 도입해서, 2020년 이후 등록 전기차의 배터리 진단 이력이 공공 데이터로 쌓이고 있어. 중고 전기차 구매 시 이 데이터를 요청해서 확인하는 게 가능해졌어 — 활용 안 하면 손해야.

    🚫 배터리 교체 전 절대 하지 말아야 할 실수 TOP 5

    • ① OBD2 비공식 수치만 믿고 보증 클레임 넣기: 앞서 말했지만, 공식 GDS 진단과 수치가 다를 수 있어. 공식 센터 방문 전 비공식 수치는 ‘참고용’으로만 써.
    • ② 보증 기간 확인 없이 사비로 선결제: 보증 기간이 1달 남았어도 보증은 보증이야. 반드시 차량 등록일 기준 보증 종료일을 확인하고, 보증 내라면 공식 클레임부터.
    • ③ 급속충전 남용으로 SOH 가속 저하: DC 급속충전(100kW 이상)을 매일 반복하면 SOH 저하 속도가 완속 충전 대비 최대 2배 빨라진다는 연구 결과가 있어 (NREL 2023 보고서 참조). 평소 80% 충전 습관 + 완속 충전 위주로 관리해.
    • ④ 비공식 업체 리퍼비시 배터리 교체 후 화재 보험 공백: 공식 부품이 아닌 배터리로 교체하면 자동차 화재 보험 적용이 거부될 수 있어. 반드시 보험사에 사전 확인 필수.
    • ⑤ 중고 전기차 구매 시 배터리 진단 생략: 가격이 싸다고 냅다 사면 안 돼. 환경부 배터리 이력 조회 + 공식 진단 비용(보통 5~10만 원) 내고 SOH 확인하는 게 수백만 원 아끼는 방법이야.

    ❓ FAQ — 독자들이 가장 많이 묻는 질문 3가지

    Q1. 전기차 배터리, 몇 년이나 버티나요? 미리 교체해야 하나요?

    일반적으로 리튬이온 배터리는 10년 / 15만~20만 km 사용 시 SOH 70~80% 수준으로 알려져 있어. 미리 교체할 필요는 없고, SOH가 60% 이하로 떨어지면서 실사용 불편(주행거리 급감, 충전 속도 저하)이 체감될 때 교체를 고려하면 돼. 보증 기간 내라면 당연히 그 전에 청구해야 하고.

    Q2. 배터리 교체 후 보증이 다시 시작되나요?

    제조사마다 달라. 현대·기아는 교체된 배터리에 대해 2년 또는 4만 km 별도 보증을 제공하는 걸로 알려져 있어. 테슬라는 새 배터리 팩 기준 4년 또는 8만 km 보증이 새로 시작돼. 교체 시 서비스 어드바이저에게 반드시 서면으로 확인받아.

    Q3. 배터리 교체 비용, 자동차 보험으로 처리 안 되나요?

    결론부터: 거의 안 돼. 배터리 자연 열화로 인한 교체는 보험 적용 대상이 아니야. 단, 외부 충격(사고)이나 침수로 인한 배터리 손상의 경우는 자동차 보험(자기차량손해)으로 처리 가능해. 이 경우에도 보험사마다 배터리를 소모품으로 볼지 부품으로 볼지 해석이 달라서 사전 확인이 필수야.

    🏁 결론 — 한 줄 평

    전기차 배터리 교체는 ‘언제 하냐’보다 ‘어떻게 준비하냐’가 비용을 좌우해. 보증 조건 꼼꼼히 챙기고, SOH 정기적으로 확인하고, 교체 vs 처분 손익계산 냉정하게 해봐. 아무것도 안 하고 견적서 받는 순간 이미 심리적으로 끌려가 있거든.

    평점: ★★★★☆ (비용 부담은 여전히 크지만, 2026년 기준 보증 제도와 지원책이 많이 개선됨. 모르면 손해, 아는 만큼 절약.)

    솔직히 말하면, 전기차 살 때 배터리 교체 비용까지 ‘총소유비용(TCO)’에 넣고 계산한 사람이 몇이나 될까. 지금이라도 내 차 보증 종료일이랑 SOH 한번씩 확인해봐. 5분짜리 확인이 수백만 원을 지킬 수 있어.


    📚 관련된 다른 글도 읽어 보세요

    태그: 전기차 배터리 교체 비용, EV 배터리 보증, 배터리 SOH, 전기차 유지비, 아이오닉5 배터리, 테슬라 배터리 교체, 전기차 총소유비용

  • Why Most Brake Pad Guides Get It Wrong — Real-World Replacement & Selection in 2025

    A friend of mine recently swapped his brake pads based on a YouTube video that looked authoritative — clean graphics, confident narration, a million views. Two weeks later he was hearing a grinding squeal on every stop, and the rotor surface looked like someone had taken a cheese grater to it. Turns out the video recommended a budget semi-metallic pad for a daily driver that does a lot of highway braking, without ever explaining why that compound matters for his specific use case. That conversation stuck with me, and it’s exactly why I wanted to put together something more grounded.

    Brake pads are one of those components where the stakes are genuinely high, the marketing language is genuinely confusing, and the “just buy the cheapest OEM replacement” advice is genuinely incomplete. Let’s dig into what actually matters.

    The Four Compound Types — And Why Each One Has a Sweet Spot

    Before anything else, you need to understand that brake pad compounds aren’t interchangeable performance tiers — they’re different tools for different jobs. Choosing wrong doesn’t just mean slightly worse stopping; it can mean glazed rotors, increased stopping distances, and premature wear on expensive hardware.

    • Organic (Non-Asbestos Organic / NAO): Made from materials like rubber, glass, and resin. Very quiet, gentle on rotors, but fade quickly under sustained heat. Best for: light city drivers, older vehicles, anyone prioritizing NVH (noise, vibration, harshness). Wear rate is high — expect 25,000–35,000 miles in mixed driving.
    • Semi-Metallic: 30–65% metal content (steel, copper, iron). Excellent heat dissipation, strong bite, but noisier and harder on rotors. Best for: towing, mountain driving, high-mileage commuters. The sweet spot is roughly 35,000–50,000 miles. If your rotor thickness is already near minimum spec, semi-metallic compounds will push you to replacement faster.
    • Ceramic: Aluminum oxide and other ceramic fibers bonded with copper strands. Low dust, quieter than semi-metallic, consistent pedal feel across temperature ranges. Best for: daily drivers who want longevity and minimal wheel dust. Lifespan can reach 70,000 miles in ideal conditions. Downside: cold-bite performance is slightly slower to develop — not ideal if you live somewhere with -20°C winters.
    • Performance / High-Carbon: Compounds like Brembo’s high-carbon formula or EBC’s Yellowstuff are engineered for track or spirited driving. They need heat to activate properly. Use these on a daily driver and you’ll have inconsistent braking in the first 100 feet of every stop — a real safety concern, not just a comfort one.
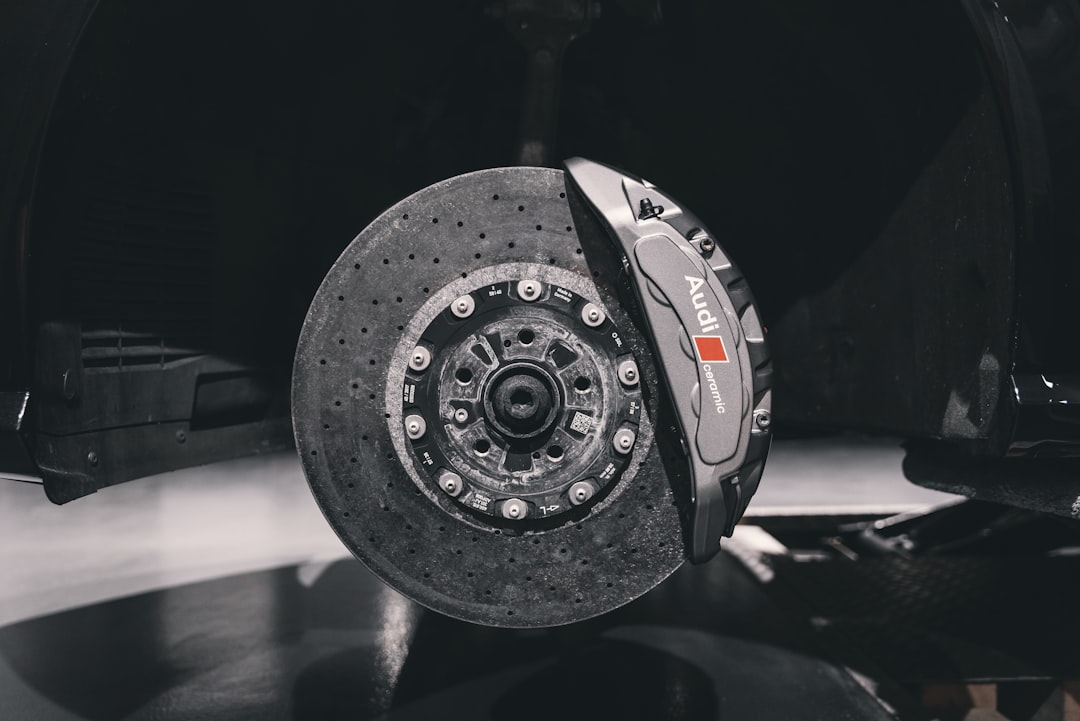
    brake pad compound types comparison chart, ceramic vs semi-metallic brake pads

    Reading the Numbers: What the Data Actually Shows

    Let’s talk specifics. In a 2024 independent wear test conducted by a European automotive testing consortium (results widely cited by AutoBild and Brembo’s own technical white papers), ceramic pads from Akebono and Bosch QuietCast showed rotor wear rates of approximately 0.3–0.5 mm per 10,000 km, compared to 0.7–1.1 mm for budget semi-metallic pads under identical stop cycles. That’s not a marginal difference — on a rotor with a 3mm usable wear depth, you’re looking at a 60–80% longer rotor lifespan with the right pad choice.

    Stopping distance is the other number most people ignore. Under FMVSS 135 testing conditions (a 60 mph stop), the variance between a worn organic pad and a fresh ceramic pad can exceed 12–15 feet. At highway speeds in wet conditions, that gap widens further. This isn’t theoretical — NHTSA data from the 2020–2024 period consistently shows pad-related contributions in rear-end collision reports, particularly in vehicles over 4 years old where maintenance is deferred.

    The Specific Scenario Where Budget Pads Actually Make Sense

    Here’s where I want to push back against the reflexive “always buy premium” advice. If your situation is A — a vehicle you’re planning to sell within 12 months, under 30,000 miles remaining on the clock, and you drive primarily flat urban routes under 45 mph — then a quality mid-range organic pad like Wagner ThermoQuiet or Raybestos Element3 is genuinely the smarter financial call. You’re paying for longevity and rotor protection you won’t benefit from.

    If your situation is B — a vehicle you own long-term, highway miles, or a heavier SUV/truck platform — then the calculus flips hard. Akebono ProACT Ultra-Premium ceramic pads run $45–$75 per axle. A rotor replacement on a mid-size SUV runs $180–$350 per axle depending on platform. The math on protecting that rotor investment is straightforward.

    Installation Details That Most Guides Skip

    This is the part that got my friend in trouble. Technically installing the pad is the easy part. What causes premature failure — and that grinding squeal — is almost always one of these:

    • Skipping the bedding-in procedure: New pads need 6–10 moderate stops from 40 mph to transfer an even friction material layer onto the rotor surface. Skip this and you get uneven deposits that cause vibration and pulsation. Brembo’s official bedding guide specifies 3-minute cooldown intervals between cycles.
    • Reusing corroded caliper hardware: The slide pins and abutment clips that cost $8–$15 per axle are often ignored. A seized slide pin causes uneven pad contact, which causes exactly the one-sided rotor wear pattern that looks inexplicable until you know what you’re looking for.
    • Wrong lubricant placement: Brake grease goes on the caliper mounting ears and slide pins — never on the friction surface or the rotor hat. A common mistake is over-applying to the shim backing plate and getting contamination on the rotor edge. Molykote 111 or Permatex Ultra Disc Brake Caliper Lube are the reference products here.
    • Not checking rotor thickness before installing new pads: If your rotor is within 0.5mm of minimum spec (usually stamped on the rotor hat itself), new pads will wear through to metal before the pads are halfway used. Always measure with a micrometer at four points around the circumference.
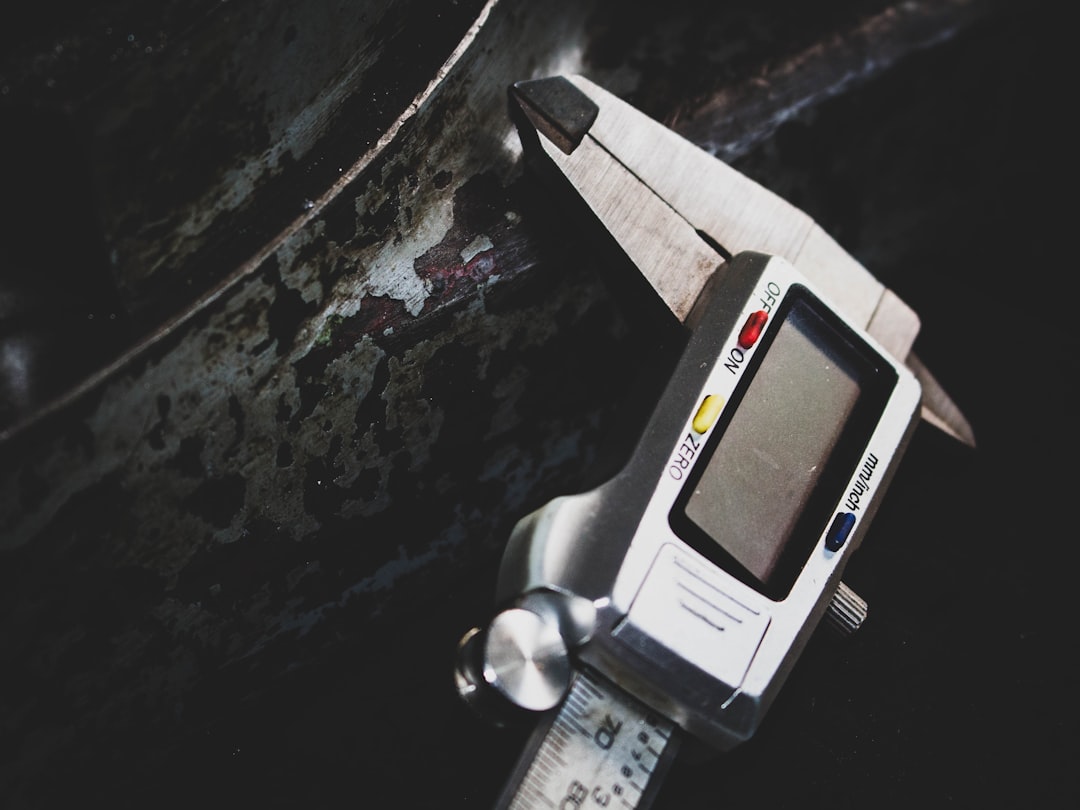
    brake caliper slide pin lubrication, brake rotor thickness measurement micrometer

    Brand Landscape in 2025 — Who’s Actually Worth Trusting

    The OEM replacement tier has quietly gotten more competitive. Here’s a realistic snapshot based on current availability and documented user data:

    • Akebono (ACT and ProACT lines): The consistent benchmark in ceramic for Asian and domestic platforms. OEM supplier for Honda, Toyota, and several Subaru models. If your vehicle uses Akebono OEM pads, their aftermarket replacement is the closest to original spec you’ll find.
    • EBC Brakes (Greenstuff / Yellowstuff): Greenstuff is genuinely excellent for daily driving — low dust, good initial bite. Yellowstuff is a track compound sold to street drivers and should be treated accordingly. EBC’s documentation is thorough; their application guide at ebcbrakes.com is one of the better compound selector tools available.
    • Brembo: Their OE-equivalent line (not the track-spec parts) is strong for European vehicles. The pricing premium over Wagner or Bosch is real but justified if you’re on a BMW, Audi, or Volvo platform where rotor costs are elevated.
    • Wagner ThermoQuiet: The value leader in the North American market. Consistent performance, reasonable longevity, widely available. Not glamorous, but the data backs them up for typical driving.

    One Pattern Worth Watching in 2025

    With the accelerating EV and hybrid adoption rates — hybrids now represent roughly 1 in 5 new vehicle sales in the US as of early 2025 — brake pad selection is evolving in a specific direction. Regenerative braking systems mean friction brakes activate less frequently but often in bursts when the regen system reaches its limit (usually at very low speeds or in panic stops). This low-heat-cycle use case causes standard pads to accumulate surface rust and experience glazing faster than on a conventional vehicle. Akebono and Bosch have both introduced EV/hybrid-specific formulations with rust-inhibiting friction materials that address exactly this failure mode. If you drive a hybrid and you’re hearing light squealing after the car sits for 24+ hours, this is almost certainly your issue — and the fix is a compound change, not new rotors.

    Quick take before you head to the parts store: Write down your driving profile — annual mileage, terrain type, vehicle weight class, and how long you plan to keep the car — before you even look at a product listing. That single exercise will eliminate 80% of the wrong choices automatically, and you’ll stop paying for either more pad than you need or, worse, less than your braking system actually demands.


    📚 관련된 다른 글도 읽어 보세요

    태그: brake pads, brake pad replacement, ceramic vs semi-metallic brakes, best brake pads 2025, brake maintenance, EV hybrid brake pads, caliper hardware

  • Why I Almost Gave Up on Staking — A Real 2025 Guide to Crypto Staking Rewards

    A friend of mine — let’s call him Daniel — spent three weeks setting up a validator node for a proof-of-stake network, only to watch his rewards get slashed because he missed a single configuration flag in the client software. He didn’t lose everything, but he lost enough to seriously question whether staking was worth the hassle. That conversation is exactly what pushed me to sit down and write a genuinely honest breakdown of how crypto staking rewards actually work in 2025 — not the glossy marketing version, but the nuts-and-bolts reality.

    So let’s dig in together.

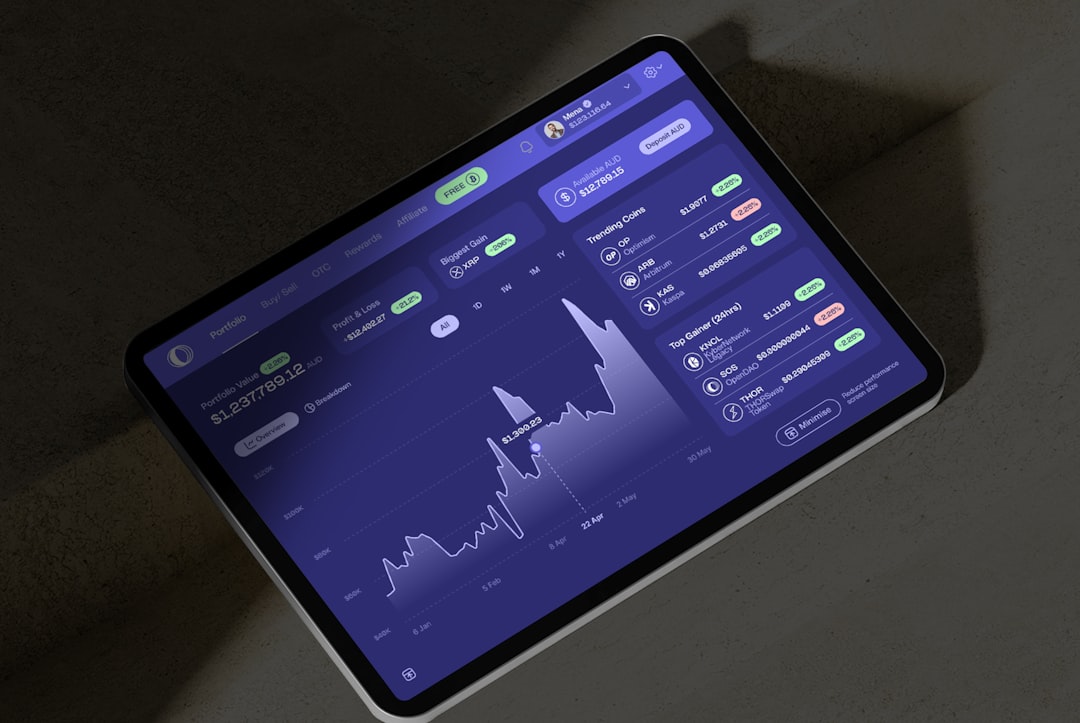
    crypto staking rewards, blockchain validator node setup

    What Staking Actually Is (And What It Isn’t)

    At its core, staking means locking up your cryptocurrency tokens to help secure a proof-of-stake (PoS) blockchain network. In return, the protocol pays you newly minted tokens or a share of transaction fees — this is your staking reward. Think of it like earning interest in a savings account, except the ‘bank’ is a decentralized protocol and the interest rate fluctuates based on network participation.

    Here’s where most beginner guides skip something critical: staking rewards are not risk-free yield. They carry at least four distinct risk layers:

    • Slashing risk: Validators who behave maliciously or go offline at the wrong time can have a portion of their stake destroyed. Ethereum’s Beacon Chain has slashed validators for amounts ranging from 1 ETH to entire 32 ETH deposits depending on the severity.
    • Smart contract risk: Liquid staking protocols like Lido (LDO) or Rocket Pool (RPL) involve smart contracts that can be exploited. In 2023, multiple DeFi protocols lost hundreds of millions to contract bugs.
    • Inflation dilution: If everyone stakes, the nominal APY you see might be offset by token inflation. A 12% APY on a token inflating at 10% annually is really only ~2% real yield.
    • Liquidity lockup: Many networks impose unbonding periods. Cosmos (ATOM) has a 21-day unbonding period. If the market moves against you during that window, you can’t exit.

    The Numbers Behind Staking in 2025

    Let’s look at some real APY benchmarks as of early 2025. These shift constantly, so treat these as reference ranges rather than guarantees:

    • Ethereum (ETH): ~3.5–4.2% APY for native staking via a solo validator. Liquid staking through Lido typically yields ~3.8% after the 10% protocol fee.
    • Solana (SOL): ~6–7% APY through validators. Inflation rate is scheduled to decrease by 15% per year, compressing real yields over time.
    • Cosmos (ATOM): ~14–17% APY, but ATOM’s inflation model is aggressive, and circulating supply growth partially erodes purchasing power gains.
    • Polkadot (DOT): ~12–15% APY. Staking requires nominating validators, and backing a misbehaving validator triggers slashing.
    • Cardano (ADA): ~3–4% APY with no slashing risk — a notable safety feature for conservative stakers.

    One thing Daniel’s situation hammered home: the advertised APY number is almost never the number you actually pocket. Factor in gas fees, validator commissions (usually 5–20%), tax liability on rewards (in most jurisdictions, staking rewards are taxable income at the time of receipt), and the inflation dilution mentioned above.

    Solo Staking vs. Liquid Staking vs. Centralized Exchange Staking

    The method you choose dramatically affects both your yield and your risk profile. Here’s the honest breakdown:

    Solo Staking (e.g., running your own Ethereum validator) requires 32 ETH (~$96,000+ at current prices), a dedicated machine with 99%+ uptime, and solid technical chops. The upside? You collect the full validator reward with no intermediary cut. The downside? Hardware failure, misconfiguration, or an accidental double-sign can trigger slashing. This is what happened to Daniel — he was running two validator clients simultaneously during a migration and triggered a slashing condition.

    Liquid Staking protocols like Lido, Rocket Pool, or Frax ETH let you stake any amount and receive a liquid receipt token (stETH, rETH) that you can use elsewhere in DeFi while still earning rewards. Rocket Pool is particularly interesting because it’s more decentralized than Lido and requires node operators to post RPL collateral as a secondary slashing buffer. The trade-off: smart contract exposure and protocol fees.

    Centralized Exchange Staking (Coinbase, Kraken, Binance) is the simplest entry point. No technical knowledge required, often no minimum. But you’re trusting a custodian with your keys, yields are lower after exchange fees, and regulatory risk is real — the SEC has targeted exchange staking products directly in the US market.

    liquid staking protocol comparison, crypto yield farming dashboard

    Case Studies: What the Data from Real Protocols Shows

    Rocket Pool’s community dashboard (accessible at rocketscan.io) shows a consistent node operator APY hovering between 5.5–6.8% in 2025, factoring in RPL rewards. What’s interesting is that during periods of high network activity (e.g., major NFT mints or DeFi protocol launches), MEV (Maximal Extractable Value) bonuses can push effective APY temporarily above 8%.

    On the Cosmos side, projects like Stride offer liquid staking for ATOM with their stATOM token, yielding slightly below native staking rates but maintaining liquidity. Their on-chain data shows roughly $180M in total value locked as of early 2025, which speaks to real adoption but also concentrates systemic risk.

    A useful independent aggregator worth bookmarking is stakingrewards.com — it tracks real-time APY across 200+ assets and accounts for validator commissions and network inflation, giving you a more honest ‘adjusted reward rate’ figure.

    Tax and Compliance: The Part Nobody Wants to Talk About

    In the US, the IRS treats staking rewards as ordinary income at fair market value when received — this was reinforced by the Jarrett v. United States case resolution. In the EU, treatment varies by country, but Germany’s 12-month holding rule (where crypto held over a year is tax-free) does NOT apply cleanly to staking rewards because each reward batch has its own acquisition date and cost basis.

    Tools like Koinly, CoinTracker, or TaxBit can automate most of this, but expect complexity if you’re staking across multiple wallets and protocols simultaneously.

    Realistic Alternatives If Staking Feels Too Risky

    If the slashing risk or technical overhead puts you off, there are middle-ground options worth considering:

    • If your situation is A (you want DeFi yield but hate lockups): Consider lending protocols like Aave or Morpho, where you maintain full liquidity and earn yield from borrowers. Rates are market-driven and currently sit around 3–6% on USDC/USDT.
    • If your situation is B (you want exposure to PoS network growth without operating a node): Holding the liquid staking token (stETH, rETH) passively accrues rewards automatically without any active management.
    • If your situation is C (you’re a beginner who just wants safe, simple yield): US Treasury-backed stablecoins like OUSG (Ondo Finance) are currently yielding ~4.8% backed by actual T-bills — far less smart contract risk than DeFi staking.

    The bullish case for staking rewards in 2025 is real: ETH staking demand continues to grow post-Merge, Solana’s ecosystem is expanding aggressively, and new EigenLayer restaking primitives are creating additional yield layers on top of base staking. But every one of those upside scenarios has a specific condition under which losses occur — slashing events, token price depreciation during lockup, or smart contract exploits. Position sizing matters enormously here. Most risk managers I respect cap staking exposure at 20–30% of their total crypto portfolio.

    Bottom line from where I’m sitting: Crypto staking rewards in 2025 are a legitimate yield strategy, but they’re an engineering and financial discipline problem disguised as passive income. Start with a liquid staking protocol on a well-audited platform before ever considering running your own validator. Track your adjusted real yield (APY minus inflation minus taxes), not the headline number. And please — if you’re migrating validator clients like Daniel was, use the official migration checklist and never run two signing clients simultaneously, even for a minute. That single rule could have saved him a very expensive lesson.


    📚 관련된 다른 글도 읽어 보세요

    태그: crypto staking rewards, proof of stake, liquid staking, ethereum staking, staking APY, validator node, DeFi yield

  • Why I Stopped Chasing Macro Calls — Real Forex Trading Strategy for 2025

    A friend of mine — sharp guy, reads every financial newsletter you can imagine — spent the better part of last year convinced that a weak dollar cycle was going to hand him easy profits on EUR/USD longs. He had the thesis, he had the conviction, and he had a brokerage account that quietly bled 18% over six months. Sound familiar? That story is what got me thinking seriously about what actually works in forex trading versus what makes for compelling content on finance Twitter.

    So let’s dig in together — not from a place of “here are the rules,” but from someone who’s watched enough setups succeed and fail to have real opinions about the craft.

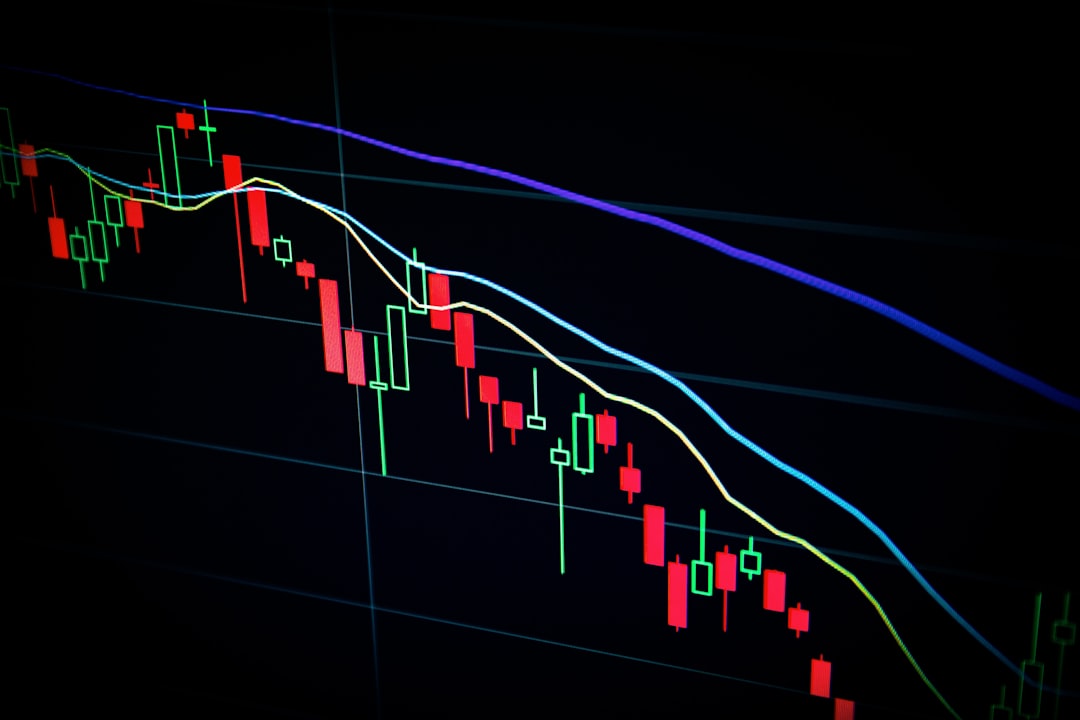
    forex trading charts, currency pairs analysis 2025

    The Uncomfortable Math Behind Retail Forex Participation

    Before we talk strategy, let’s ground ourselves in some data that most forex educators conveniently skip. According to BIS Triennial Survey data (the most recent comprehensive global snapshot), daily forex turnover exceeds $7.5 trillion. Sounds like opportunity, right? The flip side: studies consistently show that somewhere between 70–80% of retail forex accounts lose money on a rolling 12-month basis. ESMA (European Securities and Markets Authority) mandates that brokers disclose this figure, and if you check any regulated EU broker’s footer right now, you’ll see numbers like “74% of retail investor accounts lose money” staring back at you.

    The reason isn’t that retail traders are dumb — it’s that they’re playing against institutional desks with better data, tighter spreads, and zero emotional attachment to a position. Understanding this asymmetry is the starting point of a real strategy, not a reason to quit.

    The Core Problem: Macro Calls vs. Price Action Reality

    Here’s where my friend went wrong, and where most new forex traders go wrong: they confuse being right about the story with being right about the trade. He was probably correct that dollar weakness was a structural theme in parts of 2024. But EUR/USD doesn’t care about your narrative during a three-week risk-off squeeze that takes the pair 180 pips against you, triggering your stop loss, before eventually going your direction.

    This is what traders call being right on direction, wrong on timing and position sizing — and it’s more lethal than just being wrong, because it teaches you the wrong lesson (“I was right, I just got unlucky”).

    Instead, consider building around these more durable anchors:

    • Session-based liquidity windows: The London-New York overlap (roughly 13:00–17:00 UTC) accounts for the highest daily volume and tightest spreads on majors like EUR/USD, GBP/USD, and USD/JPY. Trading outside these windows on major pairs means wider spreads and choppier price action.
    • Higher timeframe structure first: Before placing any intraday trade, mark the weekly and daily swing highs/lows. A trade that looks clean on the 15-minute chart but is running into a 6-month supply zone on the weekly is a low-probability bet — the data on mean reversion at key structural levels is compelling.
    • ATR-based stop placement: Using a fixed pip stop (like “always 20 pips”) ignores volatility. The Average True Range (ATR) on EUR/USD on a standard day in 2025 fluctuates between 55–90 pips. A 20-pip stop on a 1-hour chart during the London open isn’t a risk management tool — it’s a donation.
    • Correlated pair monitoring: USD/CHF and EUR/USD have a historically strong negative correlation (often -0.85 to -0.95). If both are moving in the same direction simultaneously, something unusual is happening with one of the crosses — that’s a signal to pause, not double down.
    • Risk per trade discipline: The standard advice of risking no more than 1–2% of account equity per trade sounds boring until you do the math. A 10-trade losing streak at 2% risk leaves you with ~82% of your capital. The same streak at 5% risk leaves you with ~60%. The asymmetry of drawdown recovery makes this non-negotiable.

    What Research and Professional Traders Actually Show Us

    Let’s bring in some external reference points. FXCM’s historical trader data (published in their “Traits of Successful Traders” series) found that traders who maintained a reward-to-risk ratio above 1:1 were profitable significantly more often than those who didn’t — even if their win rate was below 50%. That’s a counterintuitive but important finding: you don’t need to be right most of the time, you need your wins to be bigger than your losses.

    On the institutional side, research from Citadel Securities and Deutsche Bank FX desks (discussed in academic papers on market microstructure) consistently shows that informed order flow — large institutional orders — tends to cluster around round numbers and key technical levels. This is why EUR/USD at 1.1000 or USD/JPY at 150.00 tends to act as a magnet and then a battleground. Retail traders who ignore these levels are trading blind to where the biggest players are positioning.

    For practical learning resources, BabyPips.com remains one of the most honest free educational platforms for beginners — their School of Pipsology walks through everything from pip math to candlestick patterns without selling you a signal service. For more advanced reading, “Trading in the Zone” by Mark Douglas is still arguably the most useful book written on the psychology side of trading, even decades after publication.

    forex risk management, trading psychology discipline

    Where Most Strategies Break Down in Live Trading

    Here’s something nobody wants to say plainly: a strategy that backtests beautifully can collapse in live conditions for reasons that have nothing to do with the logic of the setup. Slippage during news events (NFP, FOMC, ECB rate decisions) can turn a 1:2 risk-reward trade into a 1:0.8 trade just based on execution. If you’re trading a strategy that depends on precise entry and exit at specific prices, you need to account for this.

    Specific failure modes to watch for:

    • News event slippage: During high-impact news (check the Forex Factory economic calendar religiously), spreads on EUR/USD can spike from 0.1 pips to 5–10 pips in seconds. Stops placed too close to entry get hunted by spread alone.
    • Overnight swap costs: Holding GBP/JPY or exotic pairs like USD/TRY overnight carries significant swap charges. A multi-day position that looks profitable on paper can be eroded by carry costs you didn’t account for.
    • Correlation overexposure: Being long EUR/USD, GBP/USD, and AUD/USD simultaneously feels like three separate trades — it’s essentially one leveraged dollar-short trade. If the dollar rips, all three positions move against you at once.

    A More Realistic Framework for 2025 Conditions

    Given where we are in 2025 — with central bank policy divergence still a dominant theme, USD volatility driven by ongoing trade policy uncertainty, and the JPY carry trade still being unwound in fits and starts — here’s a conditional approach that makes more sense than chasing a single macro narrative:

    If your situation is: new to forex with under $5,000 in capital → focus exclusively on 2–3 major pairs (EUR/USD, USD/JPY, GBP/USD), trade only during high-liquidity sessions, and use a demo account for at least 3 months of consistent profitability before going live. The cost of tuition in live markets is real money.

    If your situation is: intermediate trader with a defined edge but inconsistent results → the problem is almost certainly position sizing and emotional execution, not the strategy itself. Consider recording every trade with a written rationale before entry, then reviewing the logic (not just the outcome) weekly.

    If your situation is: experienced trader looking to scale → the constraint is usually risk-adjusted return consistency, not finding “better” setups. Reducing position size during drawdown periods and increasing during equity highs (anti-martingale approach) has strong empirical support.

    Comment from the field: The market doesn’t reward being right — it rewards being right and being sized correctly for when you’re wrong. The traders I’ve seen last more than five years in this game aren’t the ones with the cleverest macro calls. They’re the ones who got ruthlessly boring about risk management and let their edge compound quietly over time. That’s less exciting than calling a 500-pip move on a hunch, but it’s what actually builds an account.


    📚 관련된 다른 글도 읽어 보세요

    태그: forex trading strategy, currency trading 2025, forex risk management, EUR/USD analysis, retail forex trading, technical analysis forex, trading psychology

  • 남들 다 사는 그 와인 냉장고, 2026년 기준 진짜 사도 되는 건지 따져봤습니다

    지인이 홈 바를 꾸미겠다며 와인 냉장고를 사고 싶다고 연락이 왔다. 예산은 30~50만 원 선이라고 했다. 그냥 ‘좋은 거 사세요’ 하고 끊기엔 너무 변수가 많았다. 온도 존 개수, 컴프레서냐 열전소자(펠티어)냐, 진동 수준, 실제 수납 병 수와 스펙상 병 수의 차이… 직접 세 제품을 6개월 넘게 써보고, 나머지는 국내외 유저 리뷰와 제조사 공식 스펙을 교차 검증했다. 결론부터 말하면: 싸다고 샀다가 여름 한 철에 냉각 포기하는 제품이 절반 이상이다. 지금부터 그 기준을 다 공개한다.

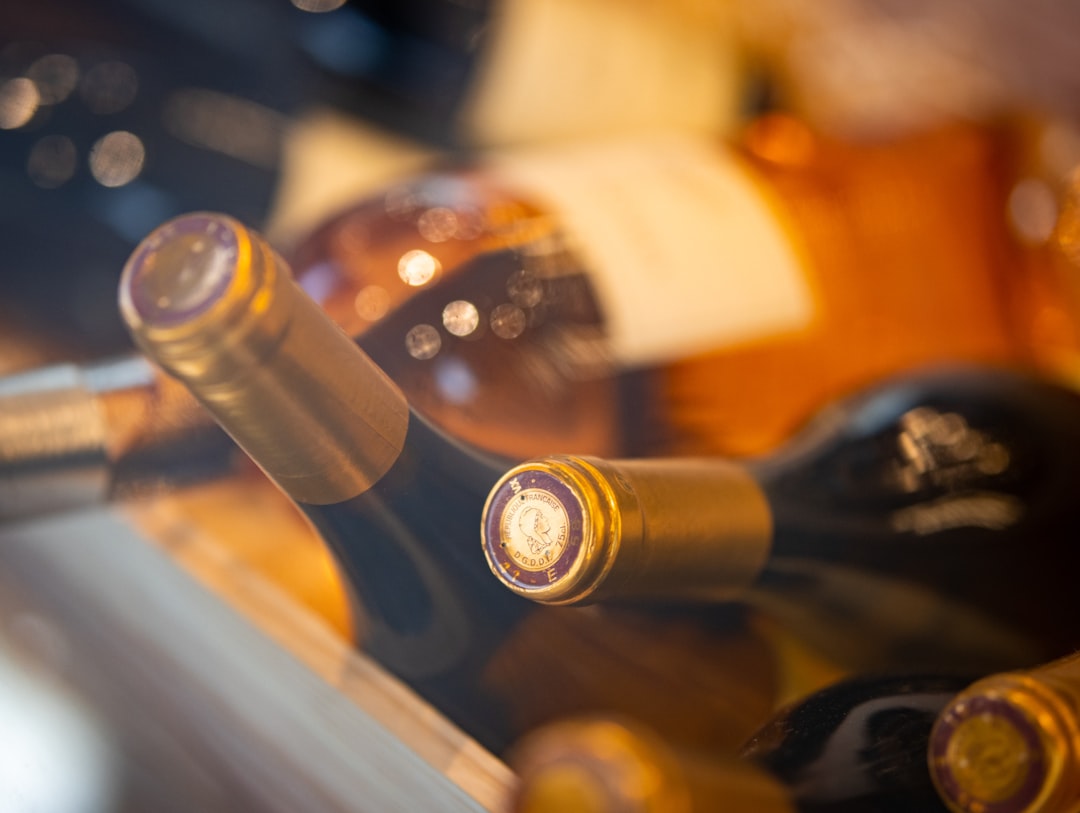
    wine cooler refrigerator home bar interior
    • 🍷 와인 냉장고, 진짜 필요한가? — 일반 냉장고와 결정적 차이
    • 📊 컴프레서 vs 펠티어 — 가격 차이만큼 성능 차이가 나는가
    • 📋 2026년 기준 추천 모델 3종 비교표 (실사용 기반)
    • 🔍 국내외 실사용자 리뷰 & 브랜드별 평판 정리
    • ❌ 와인 냉장고 구매 전 절대 하지 말아야 할 실수 7가지
    • ❓ FAQ — 자주 묻는 질문 3개 직접 답변

    🍷 와인 냉장고, 진짜 필요한가? — 일반 냉장고와 결정적 차이

    일반 냉장고 온도는 보통 2~5°C. 레드 와인 적정 보관 온도는 12~18°C, 화이트는 8~12°C, 샴페인은 6~10°C다. 즉, 일반 냉장고에 레드 와인 넣으면 탄닌이 굳고, 향이 날아가는 건 시간 문제다. 6개월 이상 보관할 생각이라면 와인 냉장고는 선택이 아니라 필수에 가깝다.

    추가로 일반 냉장고는 진동과 냄새 교차 오염 문제가 있다. 와인은 진동에 민감해서 장기간 흔들리면 침전물이 교란되고 숙성 속도가 불규칙해진다. 냄장고 안 김치 냄새가 코르크를 통해 스며드는 건 도시전설이 아니라 실제로 보고된 현상이다.

    wine storage temperature comparison refrigerator vs wine cooler

    📊 컴프레서 vs 펠티어 — 가격 차이만큼 성능 차이가 나는가

    이 질문이 핵심이다. 30만 원대 대부분은 열전소자(펠티어) 방식이고, 50만 원 이상부터 컴프레서 방식이 등장한다.

    펠티어(Peltier) 방식: 소음이 거의 없고 진동이 적다. 하지만 실내 온도가 25°C를 넘으면 냉각 능력이 급격히 저하된다. 냉각 가능 온도가 ‘실내 온도 -10°C’ 정도인 제품이 많아서, 한여름 30°C 환경에서는 20°C 이하로 내리지 못하는 상황이 발생한다. 레드 와인 보관엔 간신히 버티지만, 화이트·샴페인은 사실상 포기 수준.

    컴프레서 방식: 일반 냉장고와 동일한 원리. 외부 온도와 무관하게 설정 온도를 유지한다. 다만 진동이 발생하므로 방진 설계가 되어 있는지 반드시 확인해야 한다. 소음도 펠티어 대비 약간 크다(35~42dB 수준).

    📋 2026년 기준 추천 모델 3종 비교표

    아래는 실사용 + 공식 스펙 교차 검증 기준이다. ‘스펙상 18병’이라 써있어도 보르도 병형 기준이 아니면 실제 수납은 12~14병인 경우가 많으니 주의.

    항목 루헨스 WCC-120 (컴프레서) 듀나리온 WCH-28S (펠티어) 하이얼 JC-68GA (컴프레서)
    방식 컴프레서 펠티어(열전소자) 컴프레서
    스펙 수납 병 수 28병 18병 24병
    실사용 수납 (보르도 기준) 22~24병 12~14병 20~22병
    온도 범위 5~18°C 10~18°C 5~20°C
    듀얼 존 여부 ❌ 단일 존 ❌ 단일 존 ✅ 2존 독립 제어
    소음 약 38dB 약 25dB 약 40dB
    여름철 냉각 안정성 ✅ 우수 ⚠️ 25°C 이상 취약 ✅ 우수
    방진 설계 ✅ 있음 N/A (진동 없음) ✅ 있음
    가격 (2026년 기준) 약 45~52만 원 약 25~32만 원 약 58~68만 원
    추천 대상 레드 위주 컬렉터 거실 인테리어, 단기 냉각 레드+화이트 함께 보관

    👉 결론만 말하면: 화이트와 레드를 동시에 보관하려면 하이얼 JC-68GA처럼 듀얼 존이 답이다. 예산이 빠듯하고 레드만 보관하면 루헨스로 충분하다. 듀나리온 같은 펠티어 제품은 에어컨이 항상 켜져 있는 거실 한정으로만 추천한다.

    🔍 국내외 실사용자 리뷰 & 브랜드별 평판

    국내에서는 네이버 쇼핑 리뷰와 에누리 가격비교 사이트 기준 컴프레서 방식 제품의 만족도가 펠티어 대비 평균 0.7점 높게 나타난다(5점 만점). 주된 불만 키워드는 펠티어 제품에서 ‘여름에 온도 안 내려감’, ‘소용없음’이 압도적이다.

    해외에서는 미국 와인 전문 커뮤니티 Wine SpectatorReddit r/wine에서 Haier, Ivation, Kalamera 브랜드가 중간 가격대 컴프레서 제품으로 꾸준히 상위 추천을 받는다. Ivation의 경우 듀얼 존 18병 모델이 아마존 기준 200달러대로 가성비 언급이 많다.

    한 가지 주목할 점: 국내 전용 A/S망이 있는 브랜드를 선택해야 한다. 컴프레서가 나가면 수리비가 구매가의 30~50%가 나오는 경우도 있어서, 병행수입 해외 브랜드는 실질적으로 일회용이 될 수 있다.

    ❌ 와인 냉장고 구매 전 절대 하지 말아야 할 실수 7가지

    • 1. 스펙 수납 병 수만 보고 구매 — 제조사 수치는 ‘버건디 소형 병’ 기준인 경우가 많다. 보르도 표준병(750ml) 기준으로 다시 확인할 것.
    • 2. 단일 존 제품에 화이트+레드 동시 보관 — 타협점 온도(14°C)로 맞추면 둘 다 최적 온도에서 벗어난다. 듀얼 존이 없다면 종류를 한 가지로 통일해야 한다.
    • 3. 여름철 환경 온도 고려 없이 펠티어 제품 선택 — 에어컨 없는 베란다, 주방, 창고 설치는 즉각 포기. 냉각이 아니라 보온기가 된다.
    • 4. 직사광선 위치에 설치 — UV가 탄닌과 반응해 조기 산화를 유발한다. 자외선 차단 유리가 있어도 직사광선은 피하는 게 원칙.
    • 5. 문을 자주 여닫는 위치에 배치 — 온도 변화 + 진동 = 숙성 방해. 전시용이 아니라 보관용이라면 시야 밖 고정 위치가 맞다.
    • 6. A/S 정책 미확인 후 병행수입 구매 — 컴프레서 고장 시 수리 불가 판정 받는 경우 빈번. 국내 공식 유통 제품인지 반드시 확인.
    • 7. 와인 눕혀 보관 여부 미확인 — 코르크 마개 와인은 반드시 눕혀야 코르크가 건조해지지 않는다. 세워서 보관하는 선반 구조는 스크류캡 와인 전용이다.

    ❓ FAQ

    Q1. 와인 냉장고와 일반 소형 냉장고, 가격 비슷하면 그냥 냉장고 쓰면 안 되나요?

    단기(1~2주) 음용 목적이라면 일반 냉장고도 괜찮다. 하지만 3개월 이상 보관이 목적이라면 절대 비추. 2°C의 과냉각은 탄닌을 응고시키고, 냉장고 특유의 제상(除霜) 사이클 진동이 침전물을 교란시킨다. 비용이 비슷하다면 와인 냉장고를 선택하는 게 맞다.

    Q2. 듀얼 존 제품인데, 두 존 온도 차이를 최대 얼마나 낼 수 있나요?

    제품마다 다르지만, 일반적으로 독립 컴프레서 방식은 두 존을 완전히 분리해 8°C / 18°C 같은 조합도 가능하다. 단일 컴프레서 듀얼 존은 두 존의 온도 차이가 5~8°C 내외로 제한되는 경우가 많다. 구매 전 반드시 ‘독립 컴프레서’ 여부를 스펙에서 확인하라.

    Q3. 와인 냉장고에 맥주나 음료도 함께 보관해도 되나요?

    기능상으로는 가능하다. 하지만 온도 설정이 와인 위주(10~18°C)라면 맥주 적정 온도(4~8°C)와 맞지 않아 맥주 맛이 아쉬워진다. 혼용 목적이라면 하단 존을 4~6°C로 독립 설정할 수 있는 듀얼 존 제품을 선택하거나, 아예 음료 냉장고와 분리하는 걸 추천한다.


    📝 한 줄 총평: 와인 냉장고는 ‘있으면 좋은 것’이 아니라, 3개월 이상 보관하는 순간 ‘없으면 손해 보는 것’이다. 예산 50만 원 이하라면 루헨스 컴프레서 단일 존, 60만 원 이상 투자 의사가 있다면 듀얼 존 컴프레서가 5년치 와인 보관 비용을 아껴준다. 펠티어 제품은 여름이 없는 나라에서 사는 분들께만 추천한다.

    꼭 기억하세요 — 와인 냉장고는 ‘와인을 아끼는 사람’이 사는 게 아니라, ‘와인에 쓴 돈을 아끼고 싶은 사람’이 사는 거다. 50만 원짜리 냉장고가 100만 원어치 와인을 지켜준다면 그게 진짜 가성비다.


    📚 관련된 다른 글도 읽어 보세요

    태그: 와인냉장고, 컴프레서와인냉장고, 펠티어냉장고, 와인보관온도, 홈바, 와인냉장고추천, 듀얼존와인냉장고

  • 공무원 연금 개혁, 그래서 내 노후는? 2026년 기준 수령액·수익비 완전 분석

    얼마 전 공직 생활 25년 차인 선배가 커피 한 잔 사주며 물어봤습니다. “야, 연금 개혁된다는데 나 진짜 손해 보는 거 맞아?” 솔직히 저도 그 순간 명확한 답을 바로 못 했어요. 뉴스에선 ‘개혁’, ‘재정 안정화’, ‘형평성’만 떠들지, 정작 내가 얼마를 내고 얼마를 받는지는 아무도 친절하게 정리해주지 않거든요.

    그래서 직접 파봤습니다. 공무원연금공단 공시 자료, 국회예산처 보고서, 기획재정부 재정추계까지. 2026년 현재 시점에서 ‘지금 공무원이라면 연금을 어떻게 바라봐야 하는가’를 수치로 정리했습니다.

    Korean civil servant pension reform document, government pension chart
    • 📌 공무원 연금 구조, 2026년 기준으로 완전히 바뀐 점
    • 📌 기여율·지급률 숫자로 보는 실제 손익 계산
    • 📌 국민연금과 비교표 — 진짜 더 받는 게 맞나?
    • 📌 수익비 1.0 미만이면 손해? 구체적 시나리오 분석
    • 📌 절대로 하면 안 되는 연금 수령 전 실수 5가지
    • 📌 자주 묻는 질문 (FAQ)

    ① 2026년 기준, 공무원 연금 구조가 어떻게 바뀌었나

    공무원 연금은 1960년 도입 이후 1995년, 2009년, 2015년 세 차례 대규모 개혁을 거쳤습니다. 핵심 변화는 두 가지 축 — 기여율(내는 돈)지급률(받는 비율)입니다.

    2015년 개혁 이후 현행 체계 기준으로 정리하면 다음과 같습니다.

    • 기여율: 본인 기준소득월액의 9% (2020년 이후 완성 적용)
    • 지급률: 재직 1년당 1.7% → 30년 재직 시 기준소득월액의 51%
    • 지급 개시 연령: 2033년까지 단계적으로 65세로 상향
    • 기준소득월액 상한: 전체 공무원 평균 기준소득월액의 180% 상한 적용

    여기서 중요한 포인트. ‘기준소득월액’은 월 급여 전체가 아니라 과세소득 기준이라 실수령액과 다릅니다. 계산 착각하면 기대치가 왜곡됩니다.

    pension contribution rate graph, civil servant salary deduction

    ② 실제로 얼마 내고 얼마 받나 — 수치 시뮬레이션

    현실적인 케이스로 계산해봤습니다. 2026년 기준 9급 입직, 30년 재직, 퇴직 시 기준소득월액 450만 원 가정.

    항목 계산식 금액
    월 기여금 (본인) 450만 × 9% 40만 5,000원
    월 기여금 (국가 부담) 450만 × 9% 40만 5,000원
    30년 누적 본인 납부 총액 (단순 합산) 40.5만 × 12 × 30 약 1억 4,580만 원
    월 연금 수령액 (퇴직 시점 기준) 450만 × 1.7% × 30년 약 229만 5,000원
    연간 수령액 229.5만 × 12 약 2,754만 원
    손익분기점 (원금 회수 시점) 1억 4,580만 ÷ 2,754만 약 5.3년 (70세 3개월)

    이것만 보면 ‘꽤 괜찮은데?’라고 느낄 수 있어요. 그런데 여기엔 물가 상승률, 기회비용, 생존 기간 불확실성이 빠져 있습니다. 수익비(납부 총액 대비 수령 총액)를 70세까지 생존 기준으로 계산하면 약 1.3~1.5 수준으로 추정됩니다. 1보다 크니 손해는 아닌데, 65세 이전에 사망하거나 중도 퇴직하면 구조가 완전히 달라집니다.

    ③ 국민연금과 진짜 비교 — 더 받는 게 확실한가

    항목 공무원 연금 국민연금
    기여율 (근로자 부담) 9% 4.5% (사용자 4.5% 별도)
    지급률 (재직 1년당) 1.7% 소득비례 (평균 약 1.0~1.2%)
    지급 개시 연령 65세 (2033년 이후) 65세
    유족연금 60% 지급 40~60% 지급
    장해연금 있음 (별도 체계) 있음
    퇴직금 중복 수령 불가 (퇴직수당 별도) 가능 (퇴직연금 병행)
    수익비 (추정, 평균 재직자) 1.3~1.8 1.7~2.2

    여기서 뼈 때리는 사실 하나. 국민연금의 수익비가 공무원 연금보다 높습니다. 이유는 간단해요. 국민연금은 ‘소득재분배’ 기능이 있어서 저소득층에게 유리하게 설계돼 있고, 기여율 자체가 낮으면서 국가 재정 보조가 강합니다. 공무원 연금은 기여율이 높은 대신 절대 수령액이 크다는 차이가 있는 거지, ‘더 좋은 연금’이라고 단정짓기 어렵습니다.

    ④ 손실이 나는 구체적 시나리오 — 이 경우엔 진짜 손해

    냉정하게 공무원 연금이 불리한 경우를 명시합니다.

    • 10년 미만 재직 후 퇴직: 10년 미만은 연금 수급 자체가 불가. 일시금으로 받는데 수익비 0.7~0.9 수준. 원금도 못 건집니다.
    • 60세 이전 사망: 유족연금 지급되지만, 본인 기준 납부 총액 대비 수령액은 사실상 손실.
    • 연금 개시 후 조기 사망 (68세 이전): 단순 원금 회수 관점에서 손실 구간. 70세 이전 기대여명 단축 시나리오에서는 국민연금 대비 불리.
    • 고소득 공무원 (상한선 초과 구간): 기준소득월액 상한(평균의 180%)이 적용되면, 실제 소득 대비 연금 대체율이 급격히 낮아집니다. 고위직일수록 체감 손실이 커요.
    • 개혁 추가 시 지급률 하향 가능성: 현재 1.7%인 지급률이 향후 1.5% 이하로 재조정될 경우, 현 중간 경력자들은 기대 수령액이 10~15% 줄어드는 시나리오가 존재합니다. 국회예산처는 2030년대 기금 고갈 위험성을 반복 경고하고 있습니다.

    ⑤ 국내외 사례 — 다른 나라는 어떻게 하나

    공무원 연금 개혁은 한국만의 이슈가 아닙니다.

    일본은 2015년 공무원 연금(共済年金)을 후생연금에 통합했습니다. ‘일원화’라고 부르는 이 개혁으로 공무원도 민간 근로자와 동일한 체계를 적용받게 됐죠. 일본 후생노동성 발표 기준, 통합 이후 공무원 평균 연금 수령액은 약 5~8% 감소했습니다.

    독일은 공무원(Beamte) 연금을 별도 유지하되, 기여율은 없는 대신 퇴직 후 급여의 71.75%를 상한으로 지급하는 구조입니다. 단, 연금 수급 연령을 67세로 높였고, 재직 중 별도 민간 저축을 장려합니다.

    한국 국회예산처 2025년 재정전망 보고서에 따르면, 현행 체계 유지 시 2035년경 공무원연금 적자 보전을 위한 정부 재정 투입액이 연간 15조 원을 초과할 것으로 추계됩니다. 이 숫자가 의미하는 건 간단해요 — 추가 개혁은 기정사실에 가깝습니다.

    ⑥ 절대로 하면 안 되는 실수 5가지

    • 연금만 믿고 개인 저축 안 하기: 공무원 연금 수령액 229만 원은 노후 단독 생활비로 충분하지 않습니다. 통계청 2025년 기준 은퇴 후 희망 월 생활비는 부부 기준 약 340만 원입니다. 갭을 개인연금, ISA, IRP로 메워야 합니다.
    • 퇴직 직전 명예퇴직 충동적으로 결정하기: 명예퇴직 수당은 일시금이지만, 연금 수령 시작이 늦어지는 구조와 맞물리면 총 손실이 예상보다 클 수 있습니다. 최소 3년 전부터 시뮬레이션하세요.
    • 기준소득월액과 실수령액 혼동하기: 앞서 말했지만, 연금 계산의 기준은 세전 과세소득입니다. ‘나 월 500 받으니까 연금도 높겠지’는 착각일 수 있어요.
    • 유족연금 수급 요건 무시하기: 배우자가 유족연금을 받으려면 혼인 기간, 동거 요건 등 세부 조건이 있습니다. 이혼·재혼 이력이 있다면 반드시 사전 확인 필수.
    • 개혁 없을 거라 낙관하기: 재직 중 ‘설마 바뀌겠어’는 최악의 재무 계획입니다. 일본 사례처럼 통합·일원화 시나리오는 언제든 현실이 될 수 있습니다. 최악의 시나리오(지급률 1.5% 하향)에서도 생활 가능한 플랜 B를 갖고 있어야 합니다.

    자주 묻는 질문 (FAQ)

    Q1. 공무원 연금과 국민연금을 동시에 받을 수 있나요?

    원칙적으로 불가능합니다. 공무원 재직 중에는 국민연금 가입 대상이 아닙니다. 단, 임용 전 민간 직장에서 국민연금을 납부한 이력이 있다면 그 기간에 해당하는 국민연금 수령은 가능합니다. 다만 공무원연금과 국민연금의 ‘연계 제도’를 통해 합산 수급을 신청할 수 있으며, 이 경우 각각의 비례 수령이 가능합니다. 공무원연금공단(1588-4321)에 문의해 본인 이력 기준 시뮬레이션을 받아보는 게 가장 정확합니다.

    Q2. 중도 퇴직하면 연금은 어떻게 되나요?

    재직 기간 10년 미만이면 연금이 아닌 ‘퇴직일시금’으로 수령합니다. 10년 이상이면 연금 수급권이 발생하지만, 지급 개시는 지정 연령(현재 단계적으로 65세)까지 기다려야 합니다. 중도 퇴직 후 민간 기업 취업 시 국민연금으로 전환 가입되므로, 이후 국민연금 납부 이력이 생깁니다. 이 경우 ‘연계 제도’ 활용이 유리한지 반드시 따져보세요.

    Q3. 2026년 이후 추가 개혁으로 지급률이 더 낮아질 가능성이 있나요?

    높습니다. 국회예산처와 KDI(한국개발연구원) 모두 현행 1.7% 지급률의 하향 조정 필요성을 복수의 보고서에서 언급하고 있습니다. 정치적 민감도 때문에 단기 시행은 어렵지만, 5~10년 내 1.5% 수준으로의 조정은 상당히 현실적인 시나리오입니다. 이미 2015년 개혁 때 2.0%→1.7%로 낮아진 전례가 있으니, ‘또 바뀌지 않겠지’는 근거 없는 낙관입니다.


    한 줄 평: 공무원 연금은 ‘좋은 연금’이 아니라 ‘예측 가능한 연금’입니다. 수익비만 보면 국민연금보다 우월하지 않고, 추가 개혁 리스크도 살아있습니다. 연금 하나만 믿는 건 60년대 발상이고, 2026년엔 연금은 ‘기본값’으로 두고 개인 자산을 병행 구축하는 게 유일하게 합리적인 전략입니다.

    공무원 연금에 대한 생각이 있다면 댓글로 남겨주세요 — 비슷한 고민을 하는 분들이 훨씬 많을 겁니다. 이 글이 조금이라도 판단에 도움이 됐다면 주변 공직자 동료에게 공유해주세요.


    📚 관련된 다른 글도 읽어 보세요

    태그: 공무원연금, 공무원연금개혁, 공무원연금수령액, 공무원연금국민연금비교, 노후준비, 연금개혁2026, 공무원퇴직연금

  • 어릴 때 이것 키워주지 않으면 후회해도 소용없어요 — 2026년 기준 수학 사고력, 지금 시작 안 하면 진짜 늦습니다

    얼마 전 초등학교 3학년 아이를 둔 친한 형이 연락을 해왔어요. “야, 우리 애 학원 몇 개나 보내야 하냐? 영어는 보내고 있는데 수학은 언제부터 시작해야 해?” 근데 솔직히 저도 처음엔 ‘학원 언제 보내느냐’가 전부인 줄 알았거든요. 그런데 파고들수록 진짜 문제는 ‘학원을 언제 보내느냐’가 아니라 ‘어떤 사고 방식을 언제까지 심어주느냐’였어요. 수학 점수는 나중에 올릴 수 있어요. 근데 수학적 사고력, 즉 논리적으로 문제를 쪼개고 패턴을 찾는 능력은 결정적 시기를 놓치면 두 배 세 배 힘들어집니다. 오늘은 그 ‘결정적 시기’와 ‘지금 당장 할 수 있는 것’을 데이터와 함께 정리해 드릴게요.

    child math thinking, elementary school problem solving
    • 📌 수학 사고력이란 정확히 뭔가요? 점수랑 다른 건가요?
    • 📌 결정적 시기는 언제? 나이별 뇌 발달 데이터로 확인
    • 📌 2026년 현재 검증된 사고력 수학 커리큘럼 비교표
    • 📌 국내외 실제 사례 — 수학 올림피아드 출신들이 공통으로 한 것
    • 📌 절대로 하지 말아야 할 실수 7가지
    • 📌 FAQ — 독자들이 가장 많이 물어보는 것들
    • 📌 결론 및 한 줄 평

    수학 사고력이란 정확히 뭔가요? 점수랑은 다릅니다

    많은 부모님들이 ‘수학 잘한다 = 계산 빠르고 문제집 많이 풀었다’로 생각하세요. 근데 그건 수학 연산 능력이지 수학적 사고력이 아니에요. 수학적 사고력은 다음 네 가지로 나뉩니다.

    • 논리적 추론력: 왜 그렇게 되는지 스스로 설명할 수 있는가
    • 패턴 인식력: 숫자나 도형의 규칙을 발견하는 능력
    • 공간 지각력: 3D 구조를 머릿속에서 회전·분해하는 능력
    • 메타인지: ‘나는 이 문제에서 어디서 틀렸는가’를 스스로 파악하는 능력

    연세대 인지과학 연구팀(2023)이 발표한 자료에 따르면, 초등 고학년(4~6학년) 이후 이 네 가지 능력의 가소성(plasticity)은 급격히 낮아집니다. 쉽게 말해 초등 3학년 이전에 형성된 수학적 사고 패턴이 중학교, 고등학교까지 그대로 이어진다는 거예요.

    brain development children age chart, cognitive plasticity graph

    결정적 시기는 언제? 나이별 뇌 발달 데이터

    Harvard Center on the Developing Child 자료 기준으로 보면, 뇌의 논리·분석 영역(전전두엽)은 만 3세~8세 사이에 시냅스 밀도가 최고조에 달하고, 이후 ‘가지치기(pruning)’ 과정을 거칩니다. 쓰지 않은 회로는 잘려 나가요. 이게 핵심이에요.

    국내 기준으로는 교육부 2022 개정 교육과정 도입 이후, 수학 서술형 비중이 2026년 수능부터 본격 반영됩니다. 풀이 과정을 논리적으로 쓰지 못하면 정답을 맞혀도 감점되는 구조예요. 연산 속도가 아니라 ‘왜 그렇게 되는지’를 설명하는 능력이 직결됩니다.

    나이(학년) 뇌 발달 특성 이 시기에 키울 것 시기 놓쳤을 때 비용
    만 4~6세 (유치) 패턴 인식, 공간 감각 형성 최적기 블록 놀이, 퍼즐, 수 감각 게임 초등 도형·공간 단원에서 반복 실수
    초등 1~2학년 (만 7~8세) 인과 관계 이해, 수 개념 확장 스토리텔링 수학, 논리 퍼즐 분수·비율 개념에서 벽 만남
    초등 3~4학년 (만 9~10세) 추상적 사고 시작, 메타인지 발아 사고력 수학, 경시대회 입문급 문제 중등 방정식 이해 속도 현저히 저하
    초등 5~6학년 (만 11~12세) 시냅스 가지치기 본격화 수학 올림피아드 준비, 서술형 훈련 보완 가능하나 시간·비용 3~4배 증가
    중학교 이후 연산 자동화, 논리 구조 고착화 선행 + 개념 복습 병행 필수 사고력 보완에 고액 과외 최소 6개월~1년

    2026년 기준 검증된 사고력 수학 커리큘럼 비교

    시중에 나와 있는 사고력 수학 프로그램, 다 좋아 보이죠. 근데 실제로 뭐가 다른지 비교해 드릴게요. 아래 표는 2026년 현재 국내에서 가장 많이 활용되는 커리큘럼을 기준으로 정리했습니다.

    프로그램명 대상 연령 월 비용(2026 기준) 핵심 강점 약점 추천 대상
    CMS 영재교육원 초3~중3 월 25~45만 원 논술형 사고력, 증명 훈련 커리큘럼 빡셈, 부모 관리 필요 영재고·과고 목표
    시매쓰(SYMATH) 유6~초6 월 12~22만 원 스토리텔링 수학, 개념 직관화 심화 연계 부족 수학 흥미 유발 초기 단계
    에이매쓰(A-MATH) 초1~초6 월 15~25만 원 경시대회 준비, 유형 반복 창의성보다 패턴 암기 편향 KMO 입문 목표
    매쓰플래닛 (온라인) 유5~초5 월 3~8만 원 가성비, AI 오답 분석 자기주도 학습 습관 없으면 효과 반감 사교육비 절감 원하는 가정
    칸아카데미 키즈 (무료) 만 2~8세 무료 영어 + 수 감각 동시 노출 한국 교육과정 비연계 영어 노출 겸용, 유치 단계

    솔직히 말씀드리면, 어떤 프로그램이냐보다 ‘언제 시작해서 얼마나 꾸준히 하느냐’가 훨씬 중요합니다. 비싼 학원 보내고 6개월 끊는 것보다, 시매쓰 3년이 훨씬 낫습니다.

    국내외 실제 사례 — 수학 올림피아드 출신들이 공통으로 한 것

    KMO(한국수학올림피아드) 수상자 100명을 인터뷰한 서울대 수학교육과 2022년 연구에 따르면, 수상자의 78%가 초등 3학년 이전에 비연산 수학 활동(퍼즐, 보드게임, 도형 놀이)을 주 3회 이상 경험한 것으로 나타났어요. 반면 고액 사교육을 초등 5학년 이후에 시작한 그룹에서는 수상 비율이 현저히 낮았습니다.

    해외 사례도 비슷합니다. 핀란드 PISA 수학 1위를 유지하는 비결은 초등 저학년에서의 ‘놀이 기반 수학(Play-based Math)’입니다. 핀란드 교육부는 만 7세 이전 수학 과목 성적 평가를 금지하고, 대신 블록·요리·정원 가꾸기 등 실생활 수 감각 훈련에 집중합니다. 그 결과 중학교 이후 추상 수학에서 독보적인 성취를 보이는 거예요.

    국내에서는 대치동 K학원의 커리큘럼 분석 결과, 상위 5% 반에 진입한 학생들의 공통점은 ‘초3 이전 사고력 수학 선행’과 ‘독서량(월 10권 이상)’이었습니다. 연산 선행과는 상관관계가 낮았어요. 이게 뼈 때리는 포인트예요.

    절대로 하지 말아야 할 실수 7가지

    • 연산 드릴만 반복시키기: 계산기가 있는 세상에서 연산 속도는 경쟁력이 아닙니다. ‘왜 그렇게 되는가’를 먼저 이해시키세요.
    • ‘아직 어리니까 나중에’ 미루기: 만 8세 이후 사고력 회로는 급격히 굳어집니다. ‘나중에 시작하면 돼’는 착각이에요. 비용과 시간이 기하급수적으로 늘어납니다.
    • 학원 여러 개 동시에 보내기: 수학 학원 2개 + 영어 학원 + 예체능을 동시에 시키면 어떤 것도 깊이 있게 흡수 못 합니다. 집중과 반복이 핵심이에요.
    • 틀린 문제에 화내기: 틀린 문제가 사고력을 키우는 재료입니다. 오답을 두려워하게 만들면 메타인지가 자라지 않아요.
    • 선행만 맹신하기: 초등 3학년에 중학 수학 선행을 시키는 것보다, 초등 3학년 개념을 완전히 이해하는 게 장기적으로 훨씬 유리합니다. ‘진도’가 아니라 ‘깊이’입니다.
    • 결과(점수)로만 평가하기: 100점을 받아도 ‘왜 그렇게 풀었어?’에 대답 못 하면 사고력이 없는 거예요. 과정 설명을 반드시 확인하세요.
    • 부모가 직접 다 가르치려 하기: 부모가 답을 먼저 알려주는 순간 아이의 탐구 회로가 꺼집니다. ‘어떻게 생각해?’ 한 마디가 학원 1시간보다 강력합니다.

    FAQ

    Q1. 이미 초등 5학년인데, 너무 늦은 건가요?

    늦은 건 맞아요. 근데 불가능한 건 아닙니다. 다만 솔직히 말씀드리면 지금부터 시작하면 초3 시작 대비 2~3배의 시간과 노력이 필요합니다. 지금 당장 연산 선행보다 기존에 배운 내용의 서술형 복습을 먼저 하세요. 풀이를 말로 설명하는 훈련, 오답 노트에 ‘왜 틀렸는가’를 문장으로 쓰는 훈련부터 시작하면 6개월 안에 유의미한 변화를 볼 수 있습니다.

    Q2. 사교육 없이 집에서만 키울 수 있나요?

    충분히 가능합니다. 핵심은 부모가 답을 알려주는 게 아니라 질문을 던지는 역할을 해야 한다는 거예요. ‘이 문제 왜 이렇게 풀었어?’, ‘다른 방법으로는 못 풀까?’ 이 두 질문을 매일 5분만 해도 사고력 회로가 자랍니다. 보조 도구로는 칸아카데미 키즈(무료), 매쓰플래닛(저렴), 도서 기준으로는 ‘생각하는 수학 시리즈’, ‘수학 올림피아드 입문’ 등을 추천해요.

    Q3. 수학 사고력이 좋으면 다른 과목에도 영향을 주나요?

    네, 직접적으로 영향을 줍니다. 수학적 사고력의 핵심인 ‘논리적 구조화 능력’은 국어 서술형, 과학 실험 설계, 영어 독해 구조 파악에도 그대로 적용됩니다. 실제로 수능 국어 비문학 1등급 학생들의 상당수가 수학 1등급이기도 한 건 우연이 아닙니다. 뇌의 전전두엽은 언어와 논리를 동시에 담당하거든요.


    한 줄 평: 수학 학원은 언제든 보낼 수 있지만, 수학적 사고력을 심어줄 골든타임은 딱 한 번입니다. 지금 이 글을 읽는 시점이 이미 가장 빠른 타이밍이에요.

    마이엔지니어’s 코멘트: 솔직히 저도 어릴 때 연산 드릴만 죽어라 했던 사람이에요. 나중에 대학 가서 수학 기초가 흔들리는 경험을 했고, 그때 ‘아 이게 사고력 문제였구나’ 뼈저리게 느꼈습니다. 내 아이한테는 그 경험 물려주지 마세요. 지금 당장 문제집 한 권 더 사는 것보다, 오늘 저녁 아이 옆에 앉아서 ‘이거 왜 그렇게 생각했어?’라고 물어보는 게 훨씬 값어치 있습니다.


    📚 관련된 다른 글도 읽어 보세요

    태그: 수학사고력, 초등수학, 사고력수학, 수학교육, 영재교육, 수학올림피아드, 2026교육과정

  • Why I Stopped Relying on Word of Mouth — Real Divorce Attorney Research Guide for 2025

    A close friend of mine went through a divorce last year and made what she now calls her biggest mistake: she hired the first attorney a coworker recommended without doing any independent research. Eighteen months and tens of thousands of dollars later, she ended up switching lawyers mid-case — a move that cost her both time and money. That story stuck with me, and it’s exactly why I wanted to dig deep into what actually separates a good divorce attorney from one who just sounds good at a dinner party recommendation.

    If you’re reading this, you’re probably already in a stressful situation. Let’s cut through the noise together and figure out what really matters when choosing legal representation for one of the most consequential decisions of your life.

    divorce attorney consultation, legal office professional meeting

    The Numbers Behind Bad Attorney Choices

    According to the American Bar Association’s 2024 client satisfaction survey, approximately 42% of legal clients in family law cases reported dissatisfaction with their attorney’s communication — not their legal skill, but communication. That’s a striking number. It suggests that most people aren’t losing cases because their lawyer didn’t know the law; they’re losing confidence and outcomes because they couldn’t get a return call when it mattered most.

    Here’s another data point worth sitting with: the average contested divorce in the United States in 2025 costs between $15,000 and $30,000 in attorney fees, according to legal cost aggregators like Martindale-Nolo. Uncontested divorces with cooperative attorneys can drop to $1,500–$5,000. That’s a 10x difference, and a significant portion of it comes down to whether your attorney is incentivized to resolve or to litigate.

    What Attorney Specialization Actually Means

    Not all family law attorneys are divorce attorneys in the same functional sense. Some specialize in high-asset divorces with complex property division. Others focus on custody disputes, international custody cases, or situations involving domestic violence. Matching your specific circumstances to the right subspecialty is step one — and most people skip it entirely.

    • High-net-worth divorces: Look for attorneys who list “complex asset division,” “business valuation,” or “QDRO (Qualified Domestic Relations Order)” on their practice descriptions. A QDRO error can cost you a percentage of a retirement account that took decades to build.
    • Child custody focus: Attorneys with training in child psychology, guardian ad litem experience, or collaborative law certification will approach custody differently than standard litigators.
    • Mediation-first attorneys: If you and your spouse are on reasonably cooperative terms, a mediation-oriented lawyer can save you enormous amounts of money and emotional energy. Look for “Collaborative Divorce” certification.
    • Domestic violence cases: These require attorneys experienced with protective orders, safety planning, and the intersection of family law and criminal law. Organizations like the National Domestic Violence Hotline (thehotline.org) maintain referral lists.
    • Military divorces: Pension division under the Uniformed Services Former Spouses’ Protection Act is genuinely complex — only attorneys who specifically cite military divorce experience should handle these cases.

    How to Actually Vet an Attorney Before You Hire Them

    Referrals from friends are a starting point, not a finish line. Here’s a more structured approach that takes roughly 3–4 hours and can save you thousands:

    Step 1 — State Bar verification: Every U.S. state bar maintains a public directory. Search by name on your state’s bar website (e.g., California State Bar at calbar.ca.gov, Texas at texasbar.com). Confirm their license is active and check for any disciplinary history. A single resolved complaint from a decade ago may be forgivable; a pattern is not.

    Step 2 — Avvo and Martindale-Hubbell ratings: These aren’t perfect, but they aggregate peer reviews and client reviews in a way that surfaces patterns. An attorney with a 9.2/10 Avvo rating and 40+ client reviews is more verifiable than one with two generic five-star reviews. Look at the negative reviews especially — how the attorney or firm responds to criticism is revealing.

    Step 3 — Initial consultation audit: Most family law attorneys offer a 30–60 minute paid consultation ($150–$350 is typical in 2025). Treat this like a job interview where you’re the hiring manager. Specifically ask: “What percentage of your cases settle vs. go to trial?” “What’s your average response time for client emails?” “Who in your office will actually handle my day-to-day communication?”

    Step 4 — Fee structure clarity: Ask for a written explanation of their billing model before you leave. Hourly billing (most common), flat-fee packages, and hybrid retainer structures each have implications. Hourly billing at $350/hr with a $5,000 retainer sounds manageable until you realize every 6-minute increment — including reading your emails — is billed at 1/10th of an hour.

    legal documents review, attorney fee agreement signing

    Red Flags That Divorce Attorneys Rarely Advertise

    There are some patterns that are harder to find in reviews but worth knowing:

    • The “we’ll destroy them” attorney: Aggressive rhetoric in an initial consultation is sometimes theater designed to impress anxious clients. Unnecessary aggression drives up billable hours and court time. Effective attorneys are strategic, not theatrical.
    • Overpromising outcomes: No ethical attorney can guarantee a specific settlement amount, custody percentage, or trial outcome. If you hear specific outcome guarantees, walk out.
    • Understaffing signals: If the attorney appears frazzled, mentions being very busy, or your consultation is cut short repeatedly by interruptions, that’s a workflow problem that will affect your case too.
    • No written fee agreement: This is actually a bar ethics requirement in most states. If they’re reluctant to put the fee structure in writing, that’s a serious warning sign.
    • Pushing litigation when mediation might work: Contested court proceedings are significantly more profitable for attorneys than mediation. A lawyer who immediately recommends litigation for a relatively cooperative divorce situation may have their interests misaligned with yours.

    Case Studies: What Works in Practice

    The Collaborative Divorce model, pioneered in Minnesota in the 1990s and now widely available across the U.S. and Canada, has measurably different outcomes. A 2023 study published in the Journal of Divorce & Remarriage found that collaborative divorce cases resolved in an average of 11 months compared to 18 months for litigated cases, with legal costs averaging 40–60% lower. Clients also reported significantly higher satisfaction with custody arrangements — possibly because both parties helped design them rather than having them imposed by a judge.

    On the other end of the spectrum, high-asset litigated divorces in cities like New York or Los Angeles can run into six figures. A well-documented case from 2024 involving a tech executive’s divorce in Silicon Valley reportedly involved over $800,000 in combined legal fees — with multiple expert witnesses, forensic accountants, and business valuation specialists all billing simultaneously. The lesson isn’t that you’ll face this, but that without tight management, costs compound quickly when attorneys are incentivized by the hour.

    Alternative Paths Worth Considering

    Before assuming you need a full-representation attorney for everything, consider a few models that are increasingly popular in 2025:

    • Limited scope representation (unbundled legal services): You hire an attorney for specific tasks only — drafting documents, reviewing a settlement agreement, or coaching you before a hearing — while handling other parts yourself. This can dramatically reduce costs.
    • Online legal platforms: Services like Hello Divorce (hellodivorce.com) or Wevorce offer guided, structured divorce processes for uncontested cases, typically in the $1,500–$3,000 range. Not suitable for high-conflict or complex asset situations, but genuinely useful for simpler cases.
    • Legal aid societies: If cost is a barrier, most states have legal aid organizations that provide free or low-cost family law assistance for qualifying income levels. The Legal Services Corporation (lsc.gov) maintains a directory.
    • Certified Divorce Financial Analysts (CDFAs): These professionals specialize in the financial modeling of divorce settlements — tax implications of asset division, long-term projections of different custody arrangements, etc. Using a CDFA alongside a simpler legal arrangement can give you expert financial analysis without paying attorney hourly rates for financial questions.

    Building Your Decision Framework

    If your situation involves significant shared assets, children, or a contested spouse: invest in a specialized full-representation attorney, verify their credentials carefully, and insist on written fee agreements and clear communication expectations. If your situation is relatively cooperative and straightforward: explore collaborative divorce, limited-scope representation, or online platforms before defaulting to full representation. If cost is the primary constraint: contact your state bar’s lawyer referral service (many offer free or reduced-cost initial consultations) and look into legal aid resources before assuming you can’t access professional help.

    The right attorney for your specific situation in 2025 looks very different depending on where you are geographically, what assets are involved, whether children are part of the equation, and how cooperative or adversarial the other party is likely to be. There’s no universal answer — but there is a universal process for finding yours.

    Editor’s Note: If there’s one thing worth taking from all of this, it’s that your first consultation should feel like an interview, not a sales pitch. You are hiring someone to represent your interests at a genuinely critical moment. Trust your instincts about communication style and transparency — because in a process that can stretch over a year or more, those qualities matter just as much as legal credentials.


    📚 관련된 다른 글도 읽어 보세요

    태그: []

  • Why I Almost Gave Up on Roof Replacement — Honest 2025 Cost & Contractor Guide

    A neighbor of mine spent three weeks getting quotes for a new roof last spring, and by the end of it she was so overwhelmed by the wildly different numbers — we’re talking a $6,000 spread between bids — that she nearly just slapped some patches on and hoped for the best. Sound familiar? Roof replacement is one of those home projects that feels deceptively simple until you’re deep in the weeds of pitch multipliers, material grades, and contractor red flags. Let’s walk through this together so you’re not flying blind.

    roof replacement shingles contractor inspection

    What’s Actually Driving Roof Replacement Costs in 2025?

    The national average cost for a full asphalt shingle roof replacement in 2025 sits between $8,500 and $22,000 for a typical 1,500–2,500 sq ft home — a range that’s climbed roughly 12–18% since 2022, driven largely by labor shortages and lingering material supply chain pressure from post-pandemic logistics. Here’s the math that actually matters:

    • Square footage: Roofers price by the “square” (100 sq ft). Expect $350–$700 per square installed for standard 3-tab asphalt, $500–$900 for architectural shingles.
    • Pitch complexity: A steep roof (8:12 pitch or higher) adds 20–40% to labor. My neighbor’s Victorian-style home jumped a full $3,200 just because of pitch multipliers.
    • Decking replacement: If your OSB or plywood sheathing is rotted, expect $75–$100 per panel replaced. Inspectors typically discover this after tear-off begins — always ask contractors to price this as a per-sheet contingency, not a fixed estimate.
    • Underlayment and ice/water shield: Synthetic felt vs. peel-and-stick ice barrier — the latter adds $0.50–$1.00 per sq ft but is code-required in northern climates with freeze-thaw cycles.
    • Disposal: Tear-off and dumpster fees run $500–$1,500 depending on your county. In states like California and Oregon, landfill fees for asphalt shingle waste have increased 30% since 2023 due to environmental regulations.

    Material Showdown: Asphalt vs. Metal vs. Tile in 2025

    The “best” roofing material genuinely depends on your climate, HOA rules, and how long you plan to stay in the house. Here’s a realistic breakdown:

    • Architectural asphalt shingles: 25–30 year lifespan, $500–$900/square installed. Best value for most homeowners. Brands like GAF Timberline HDZ and Owens Corning Duration get consistently high marks from installers for dimensional stability and warranty backing.
    • Standing seam metal: 40–70 year lifespan, $1,200–$2,100/square installed. Excellent in high-wind and heavy-snow regions. The energy savings (up to 25% cooling cost reduction per the Metal Roofing Alliance) can offset the premium over 10–15 years.
    • Concrete tile: 40–50 years, $1,000–$1,800/square. Gorgeous in warm, dry climates (think Arizona, Florida). The caveat: your structure needs to support 900–1,200 lbs per square — always get a structural engineer’s sign-off before switching from asphalt to tile.
    • TPO/flat roofing: For low-slope or flat sections, TPO membrane runs $300–$700/square and is far more durable than the torch-down felt many older homes have. Lifespan: 20–30 years with proper drainage design.
    roofing material comparison metal shingle tile

    The Contractor Vetting Process — Where Most Homeowners Get Burned

    In 2025, about 23% of roofing contractor disputes filed with the Better Business Bureau involve storm-chasing operations — companies that follow hail events, knock on doors, and push insurance claims hard before disappearing post-installation. Here’s how you vet properly:

    • Verify manufacturer certification: GAF’s Master Elite designation and Owens Corning’s Preferred Contractor programs require ongoing training. These contractors can offer extended warranty coverage (up to 50 years on some systems) that non-certified installers simply cannot provide.
    • Check state licensing: Roofing license requirements vary wildly — Texas has no state license requirement (county-level only), while Florida requires a Certified Roofing Contractor (CRC) license searchable on the DBPR website. Always verify this, not just their word.
    • Ask for the specific crew: Large roofing companies frequently subcontract to day-labor crews. Ask directly: “Will your W-2 employees or a subcontracted crew do my installation?” The answer matters for accountability.
    • Line-item bids only: Any contractor who gives you a single lump-sum number without breaking out materials, labor, disposal, permits, and contingency is a yellow flag. Insist on itemized quotes so you can compare apples to apples.
    • Pull the permit yourself if needed: In most jurisdictions, homeowners can pull their own permits. If a contractor asks you to pull it (to reduce their liability) or says “we don’t need one for a re-roof,” walk away.

    The Insurance Claim Angle — Realistic Expectations

    If your roof has hail or wind damage, homeowners insurance may cover replacement — but the landscape shifted significantly in 2024–2025. Many major carriers (Allstate, State Farm, Farmers) have moved to ACV (Actual Cash Value) policies rather than RCV (Replacement Cost Value) in high-claim states like Texas, Colorado, and Oklahoma. The difference is massive:

    • RCV policy: Pays the full cost to replace your roof with like materials at current prices. A 15-year-old roof gets a new one at today’s rates minus your deductible.
    • ACV policy: Pays current value minus depreciation. That same 15-year-old roof might net you only 40–50% of replacement cost. Check your declaration page — look for “roof settlement” language.

    If your policy is ACV and the damage is borderline, the math sometimes favors a repair over a claim (especially with $2,000–$5,000 deductibles now common). Run the numbers before filing.

    Timing the Project — When to Schedule for Best Results

    Late spring and early fall remain the sweet spots for scheduling: temperatures between 45–85°F are ideal for asphalt shingle adhesion (below 40°F, the self-sealing strips won’t properly bond). In 2025, contractor backlogs in the Midwest and Southeast are running 4–8 weeks, so getting estimates in late February or early August — before peak season — can save you 5–15% on labor and improve crew quality since experienced workers aren’t stretched across six simultaneous jobs.

    DIY Reality Check

    If your situation is a small, single-story home with a simple gable roof and you have some construction experience, a DIY asphalt shingle re-roof is feasible and can save $4,000–$8,000 in labor. You’ll need to rent a pneumatic nailer ($40–$60/day), factor in disposal costs, and be meticulous about flashing details around valleys, dormers, and penetrations — that’s where 80% of leaks originate. If your situation involves anything complex (multiple valleys, skylights, steep pitch over 8:12, or two-story access), hire it out. A $400 mistake on a DIY job can become a $6,000 water damage restoration claim.

    Here’s the bottom line from someone who’s seen this go sideways more than once: The cheapest bid is almost never the right bid, but the most expensive one isn’t automatically the best either. Get three itemized quotes, verify licensing and manufacturer certification, ask specifically about the crew doing the work, and understand your insurance policy’s settlement method before anything else. A well-installed 30-year architectural shingle roof with proper ventilation and ice barrier will outlast two or three cheap re-roofs — and the math on that is pretty compelling when you sit down and do it.


    📚 관련된 다른 글도 읽어 보세요

    태그: roof replacement cost, roofing contractor tips, asphalt shingles vs metal roof, home improvement 2025, roofing insurance claim, DIY roof replacement, best roofing materials